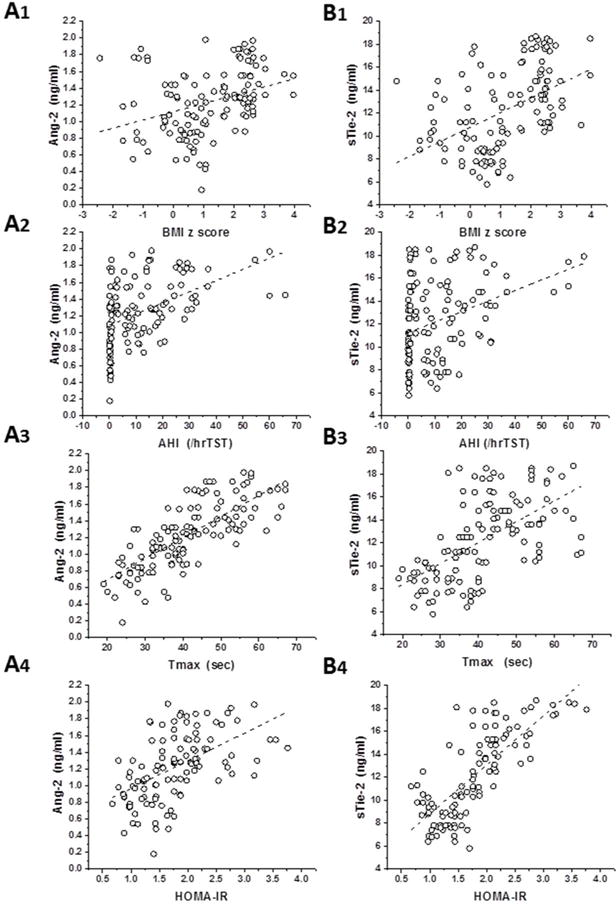
Figure 2. Scatterplots of Ang-2 (A panels 1–4) and sTie-2 plasma levels (B panels 1–4) vs. BMI z score, obstructive apnea hypopnea index (AHI), Tmax, and HOMA-IR in children with and without obesity or OSA.

Panel A1 - r2=0.10, p<0.01
Panel A2 - r2=0.22, p<0.001
Panel A3 - r2=0.57, p<0.001
Panel A4, r2=0.29, p<0.001
Panel B1: r2=0.22, p<0.001
Panel B2: r2=0.12, p<0.01
Panel B3: r2=0.34, p<0.001
Panel B4: r2=0.59, p<0.001
