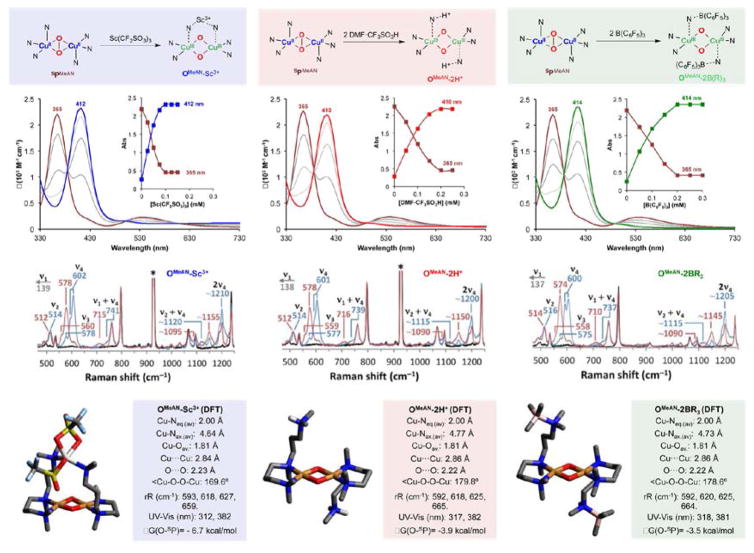
Figure 5.
Top: Generation of the different OMeAN-LA complexes. Middle: Spectroscopic characterization of the OMeAN-LA series by UV–vis (inset shows titration experiments) and rR at 413.1 nm excitation (16O2 in blue, 18O2 in red, and Cu(I) background in black). Mode assignments are indicated, and instrument artifacts are marked with (*). Bottom: Structures of DFT-optimized OMeAN-LA species with relevant metrical parameters, calculated Cu–O normal modes, TD-DFT-calculated LMCT energies, and energy of peroxo isomers relative to the corresponding bis(μ-oxo) isomers.

