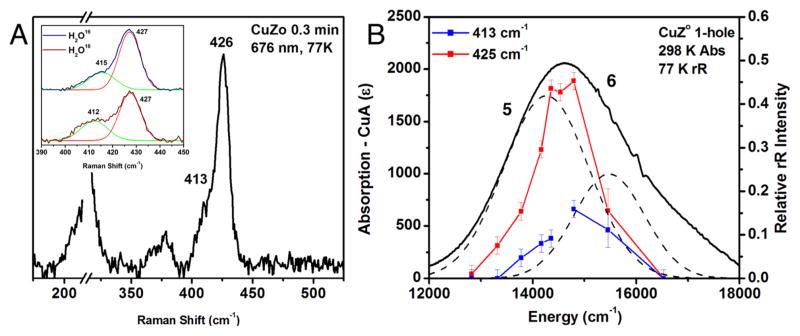
Figure 4.
Resonance Raman spectrum and profile of CuZ°, obtained after 15 s of reaction with N2O. (A) Spectrum at 77 K, excitation energy 676 nm. Inset, O16/O18 isotope perturbation observed after formation of CuZ° in H2O16 or H2O18 100 mM phosphate at pH 7.6. The O16/O18 isotope data were fit with two bands of identical width, where in the O18 spectrum green band decreases in energy by 3 cm−1 and has 36% more intensity. (B) Left scale, room temperature absorption of CuZ° at 30 s (after subtraction of oxidized CuA and 1-hole CuZ contributions; right scale, dependence of the normalized intensity of the vibrations of CuZ° on excitation energy.

