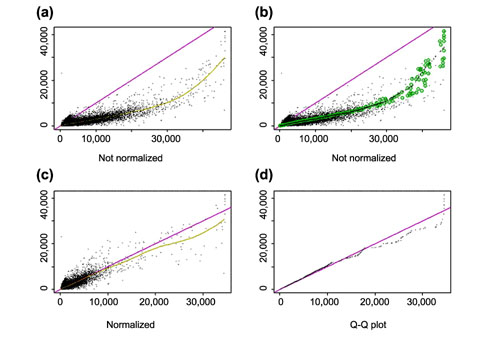
Figure 10.

Similar plots as in Figure 9 for arrays hybridized to two different samples (array 24 and 36 of array set 5). (a) CEL intensities; (b) same plot as in (a) with superimposed circles representing the invariant set; (c) after renormalization; (d) Q-Q plot of normalized probe intensities. Note that the smoothing spline in (a) is affected by several points at the lower-right corner, which might belong to differentially expressed genes. The invariant set, on the other hand, does not include these points when determining the normalization curve, leading to a different normalization relationship at the high end.
