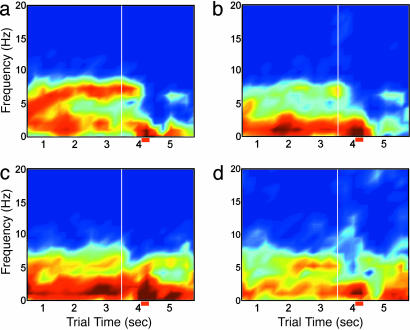
Fig. 2.
Dynamic power spectra show changes over the behavioral epochs. Averaged power spectra are shown for the four recording sites across a set of 25 nonconsecutive CS+ trials chosen for similarity in response time. Spectra are estimated for each 1,024-ms time window, stepped by 250 ms. Odor onset is indicated by the vertical white line at 3.5 s, and the average response time ± standard deviation is shown below each matrix (red horizontal bar). Color scale indicates log dimensionless power and is constant for the four plots. (a) OB frequencies occupy all parts of the theta band, with 7-10 Hz predominating during the sniffing period. (b) aPC theta is similar to that in the OB. (c)EC theta oscillations cover the lower end of the theta band, from 4 to 7 Hz, rarely showing peaks in the higher portion of the band. (d) HPC theta occupies two bands corresponding to the definitions of type 1 (7-12 Hz) and type 2 (4-6 Hz) theta. Very low-frequency power in all spectra is due to the 1/f nature of the power spectra in most cortical areas. The data have been log-transformed to attenuate this effect.

