
Figure 2.
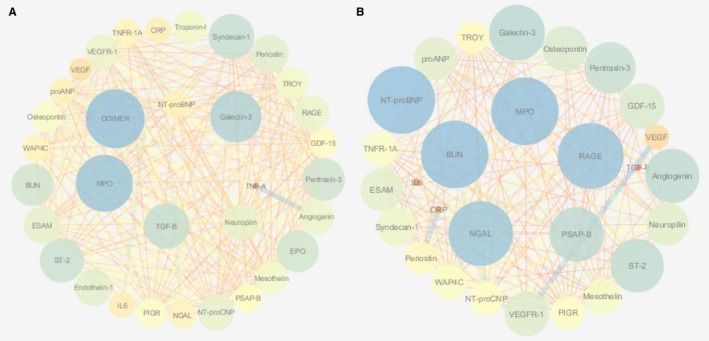
Network analysis depicting associations between biomarkers in HFrEF (A) and HFpEF (B). Associations shown are those that passed the P‐value cutoff (0.05/21). Node size and color are based on the clustering coefficient. The edge betweenness was used as a criterion for the edges. BUN indicates blood urea nitrogen; CRP, C‐reactive protein; EPO, erythropoietin; ESAM, endothelial cell‐selective adhesion molecule; GDF‐15, growth differentiation factor 15; HFpEF, heart failure with preserved ejection fraction; HFrEF, heart failure with reduced ejection fraction; IL‐6, interleukin 6; MPO, myeloperoxidase; NGAL, neutrophil gelatinase‐associated lipocalin; NT‐proBNP, N‐terminal pro‐brain‐type natriuretic peptide; NT‐proCNP, amino terminal pro‐C‐type natriuretic peptide; PIGR, polymeric immunoglobulin receptor; proANP, pro‐atrial‐type natriuretic peptide; PSAP, prostate‐specific acid phosphatase; RAGE, receptor of advanced glycation end‐products; ST‐2, suppression of tumorigenicity 2; TGF‐β, transforming growth factor β; TNF‐α, tumor necrosis factor α; TNF‐α‐R1a, tumor necrosis factor α receptor 1a; VEGF, vascular endothelial growth factor; VEGFR, vascular endothelial growth factor receptor; WAP4C, WAP 4 disulfide core domain protein.