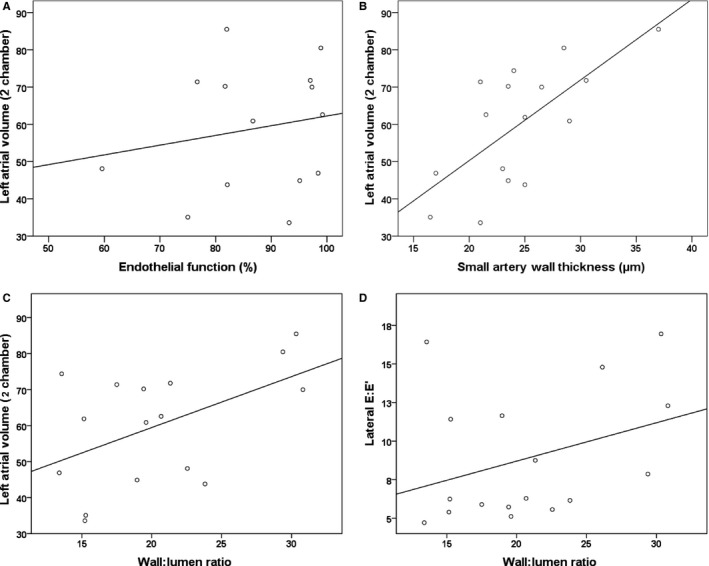
Figure 2.

Correlation curves for small artery measurements against echocardiographic parameters. Correlation curves illustrating associations between (A) left atrial volume and endothelial function (r=0.210, P=0.57); (B) left atrial volume and small artery wall thickness (r=0.718, P=0.02); and (C) left atrial volume and small artery wall:lumen ratio (r=0.605, P=0.02); (D) lateral E:E′ and wall:lumen ratio (r=0.596, P=0.02).
