
Figure 5.
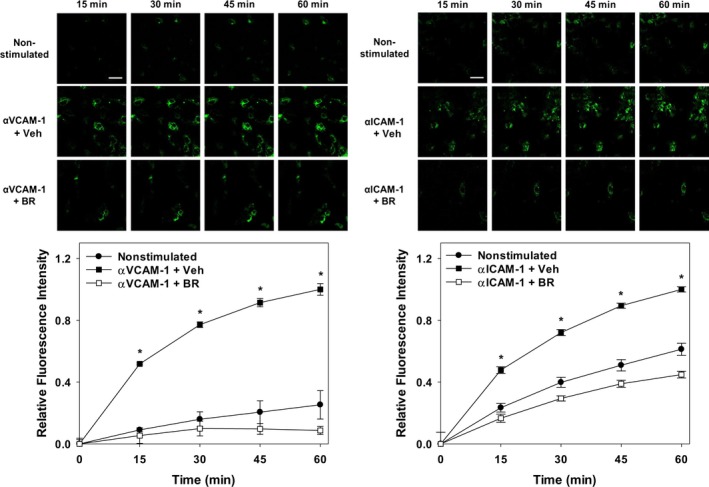
Bilirubin suppresses cellular ROS generation following activation of VCAM‐1 or ICAM‐1. TNF‐α‐activated HUVEC monolayers were incubated with anti‐VCAM‐1 (left panels, αVCAM‐1; 10 μg/mL) or anti‐ICAM‐1 (right panels, αICAM‐1; 10 μg/mL) for 30 minutes and then loaded with dihydrorhodamine. Adhesion molecule activation was triggered by the addition of a cross‐linking antibody and ROS generation quantified by confocal microscopy. Upper panels display representative time‐lapse images of nonstimulated and antibody‐activated cells treated with 20 μmol/L of bilirubin (BR) or the bilirubin vehicle (Veh). Scale bars represent 100 μm. Lower panels plot the time‐dependent changes in fluorescence intensity following VCAM‐1 (left panel) or ICAM‐1 (right panel) activation (squares), in the presence (white symbols) or absence (black symbols) of bilirubin. Cells that were not treated with cross‐linking antibodies (nonstimulated; circles) serve as control, with curves reflecting mean fluorescence intensity (±SEM) expressed relative to maximal activation at 60 minutes (n=3 sets of experiments). *P<0.001 vs nonstimulated, αVCAM‐1+BR and P<0.001 vs nonstimulated, αICAM‐1+BR. HUVEC, human umbilical vein endothelial cell; ICAM‐1, intercellular adhesion molecule 1; ROS, reactive oxygen species; TNF‐α, tumor necrosis factor alpha; VCAM‐1, vascular cell adhesion molecule 1.