
Figure 6.
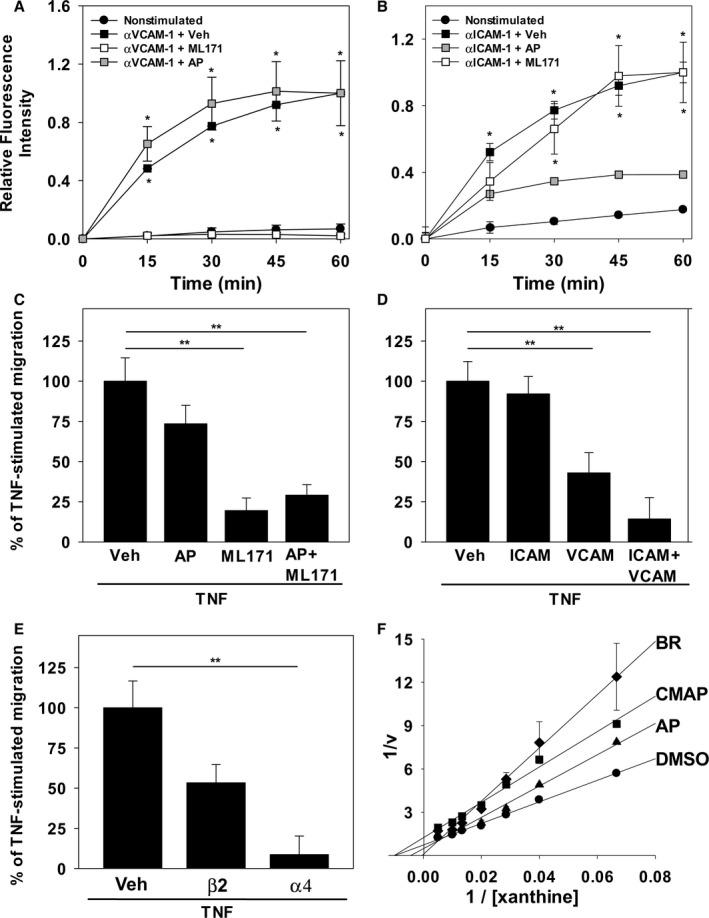
Nox and XO inhibitors and antibodies against VCAM‐1 and ICAM‐1 recapitulate the effect of bilirubin on endothelial ROS generation and monocyte transmigration. ROS production by TNF‐α‐stimulated HUVEC monolayers was assessed by monitoring dihydrorhodamine fluorescence following activation of VCAM‐1 (αVCAM‐1) or ICAM‐1 (αICAM‐1), as described in Figure 5. A and B, Time‐dependent changes in fluorescence intensity following VCAM‐1 (A) or ICAM‐1 (B) activation (squares), in the absence (black symbols) or presence of 10 μmol/L of ML171 (white symbols), or 40 μmol/L of allopurinol (AP; gray symbols). Curves reflect mean fluorescence intensity (±SEM) expressed relative to maximal activation at 60 minutes (n=3 sets of experiments). C, Compares the effect of the DMSO vehicle (Veh), 40 μmol/L of AP, and/or 10 μmol/L of ML171 on THP‐1 cell migration across HUVEC monolayers, as described in Figure 2 (n=4 sets of experiments). D and E, Results of analogous studies examining THP‐1 migration in the presence or absence of antibodies against ICAM‐1 (ICAM; 10 μg/mL), VCAM‐1 (VCAM; 10 μg/mL), β2 (5 μg/mL), and/or α4 (20 μg/mL). F, Lineweaver–Burk plot of H2O2 produced by isolated XO in the presence of 50 μmol/L of bilirubin (BR; diamonds; Ki=3.4 μmol/L), 30 μmol/L of the competitive inhibitor, AP (triangles; Ki=6.7 μmol/L), 30 μmol/L of the noncompetitive inhibitor, 2‐chloro‐6(methylamino) purine (CMAP; squares; Ki=4.7 μmol/L), or the DMSO vehicle (circles). Data reflect the mean (±SEM) of 3 sets of experiments. *P<0.001 verus nonstimulated, αVCAM‐1+ML171 and P<0.001 vs nonstimulated, αICAM‐1+AP; **P<0.05. HUVEC indicates human umbilical vein endothelial cell; ICAM‐1, intercellular adhesion molecule 1; Nox, NADPH oxidase; ROS, reactive oxygen species; TNF‐α, tumor necrosis factor alpha; VCAM‐1, vascular cell adhesion molecule 1; XO, xanthine oxidase.