
Figure 2.
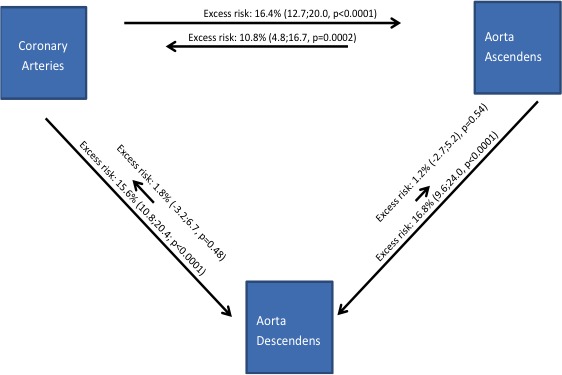
Five‐year progression of calcification with relations between vascular beds. Lengths of arrows indicate excess risk of 5‐year onset in the artery where the arrow points and contrasting presence and absence of baseline calcification where the arrow originates, IQR indicates interquartile range.