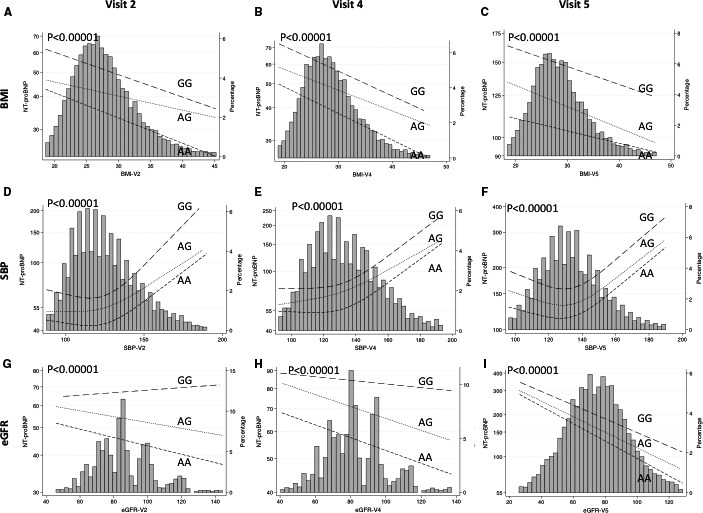
Figure 2.

Geometric mean N‐terminal pro–B‐type natriuretic peptide (NT‐proBNP) vs body mass index (BMI; A‐C), systolic blood pressure (SBP; D‐F), and estimated glomerular filtration rate (eGFR; G‐I) by genotype at rs198389 at visit 2 (average age 57), visit 4 (average age 63), and visit 5 (average age 76). The histogram represents the distribution of the variable on the x axis and the lines represent spline smoothed mean values of NT‐proBNP within rs198389 genotypes at each x axis variable level. P value for test of equality between rs198389 genotypes. Adjusted for age, sex, and race; SBP adjusted for +15 mm Hg if taking antihypertension medications.
