
Figure 3.
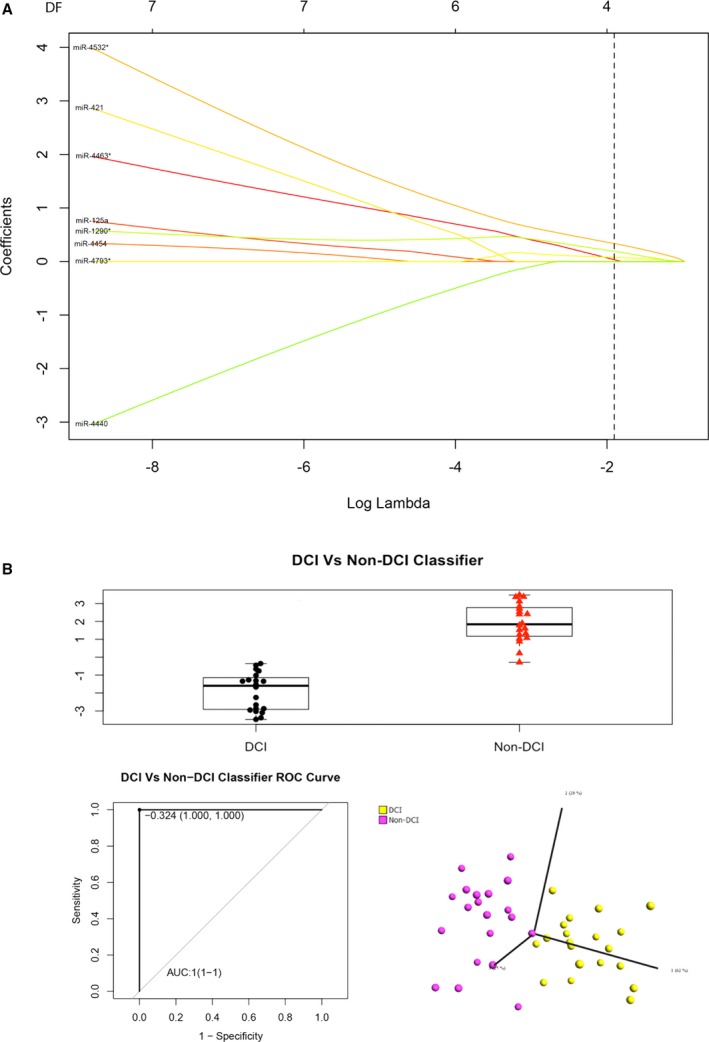
A, LASSO (least absolute shrinkage and selection operator) regression analysis, (B) the box‐and‐whisker plot (upper panel), receiver operating characteristic (ROC) curve (bottom left panel), and principal component analysis (bottom right panel) of the 4 microRNAs (miR‐4532, miR‐4463, miR‐1290, and miR‐4793‐3p) in the subarachnoid hemorrhage groups with and without delayed cerebral infarction (DCI) in the classification algorithm. AUC indicates area under the curve.