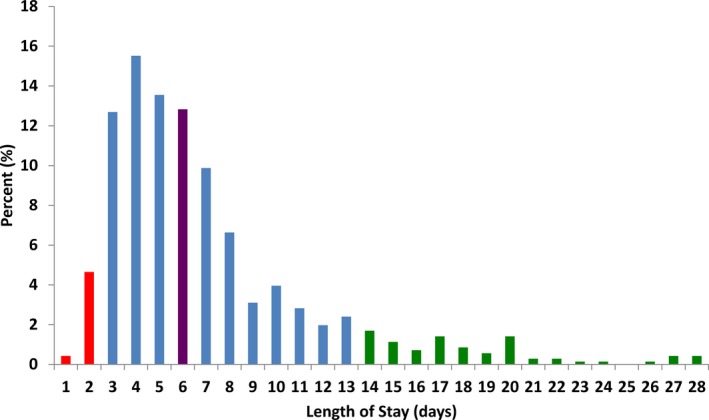
Figure 2.

Distribution of length of stay post‐TAVR. The proportion of patients for each length of stay post‐TAVR is depicted. The lower 10th percentile is depicted in red and the upper 90th percentile in green. Median length of stay is depicted in purple. TAVR indicates transcatheter aortic valve replacement.
