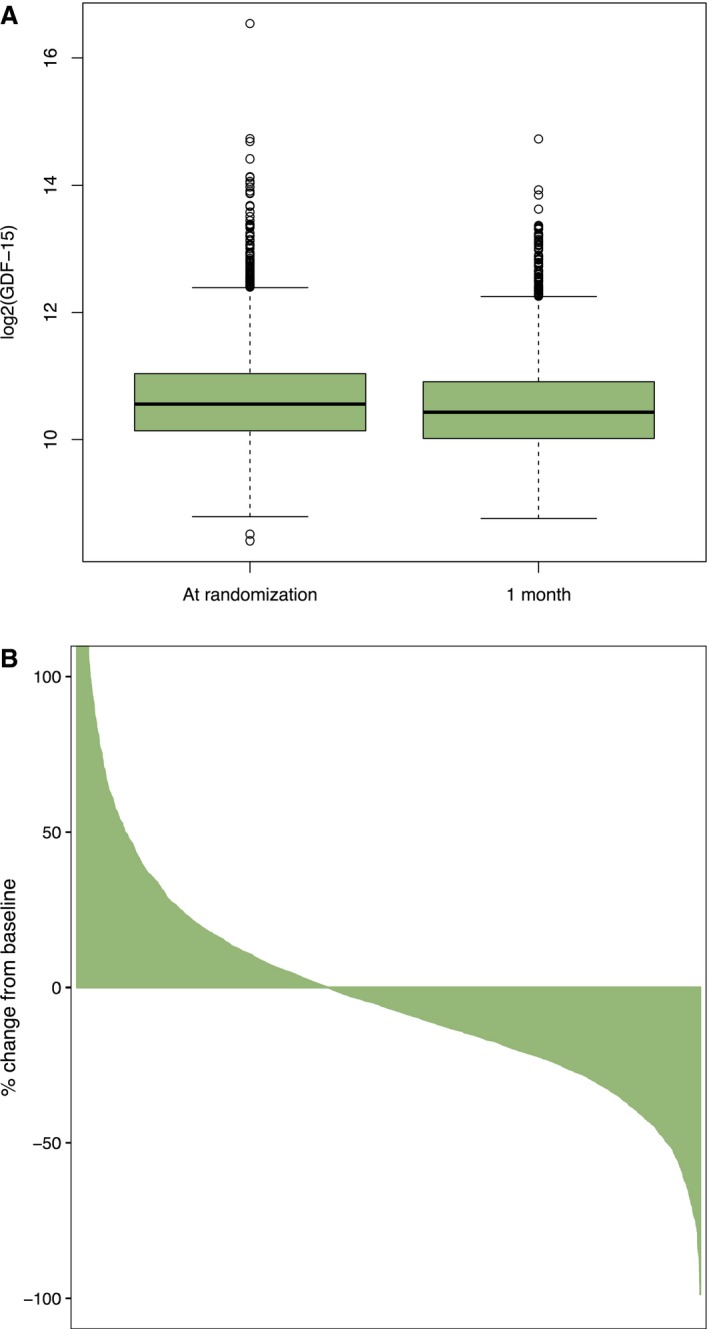
Figure 1.

GDF‐15 at baseline and at 1 month. A, Log2‐transformed GDF‐15 levels. B, Waterfall plot indicating relative change in GDF‐15 levels between baseline and 1 month (please note that data are truncated at ∼+100%; a few patients had >100% relative increase in GDF‐15). The plot is an ordered bar plot, where each patient's % change in GDF‐15 from baseline to 1 month is plotted. Although GDF‐15 levels were only slightly lower on the population level (A), some patients had substantial relative changes in GDF‐15 (B). GDF‐15 indicates growth differentiation factor‐15.
