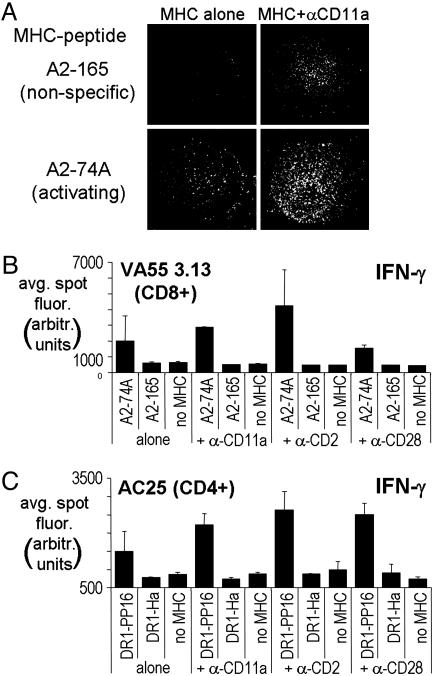
Fig. 2.
The effect of costimulation on T cell detection. (A) HLA-A2+ MVA-74A peptide-specific T cells incubated for5honan MHC–peptide array at ≈10 cells per mm2 (3 × 10⁵ cells per chamber on a four-chamber slide) and stained with Hoechst nuclear stain. (Left) MHC complexes were arrayed alone at 50 μg/ml. (Right) α-CD11a adhesion antibodies were coimmobilized with MHCs. (Top) Nonactivating MHC–peptide array elements. (Bottom) Activating MHC–peptide spots. The single spot images shown are characteristic of such spots on replicate arrays. (B and C) Average spot intensities (in arbitrary fluorescence units) for IFN-γ secretion by 106 cells in response to 6-h incubation with array elements incorporating various types of costimulatory antibodies. (B) Response of VA55 3.13, a CD8+ line specific to A2–74A. (C) Response of AC25, a CD4+ clone specific to DR1–PP16.

