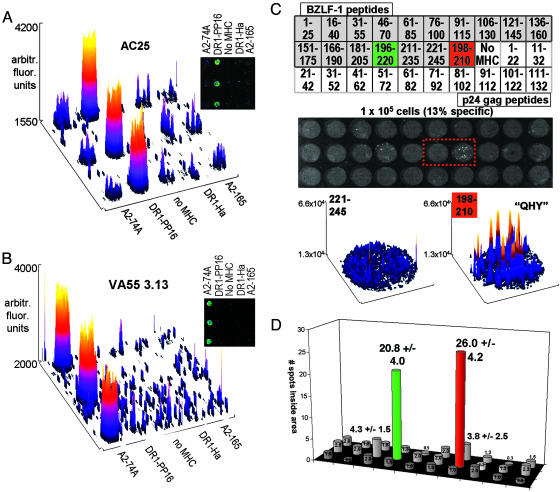
Fig. 3.
Arrayed class I and class II epitopes are specifically recognized by human CD8+ and CD4+ T cells. (A and B) MHC–peptide complexes and α-CD11a antibody were immobilized with α-IFN-γ capture antibody. The chips were incubated with 106 T cells for 6 h, and IFN-γ was detected. Fluorescence intensity on the chip is shown as a 3D surface plot of the array area, and a raw-fluorescence image is shown (Inset). (A) CD4+ clone AC25, specific to DR1–gag. (B) CD8+ line VA55 3.13, specific to A2–74A. (C) Response of a short-term polyclonal human T cell line against the EBV protein BZLF-1 (15) was analyzed by using overlapping peptides covering the sequence of the protein, each in complex with HLA-DR1. Additional spots contained the previously identified minimal epitope peptide QHY (BZLF-1 [198–210]), a series of HIV p24 gag overlapping peptides, and other control complexes for a total of 50 spots in an area of 192 mm2.(Top) A partial map of the array. The array was incubated with 100,000 T cells, of which ≈13% were specific to BZLF-1 by intracellular cytokine staining (≈13,000 specific cells or 60 per mm2). The secreted IFN-γ detected after a 6-h incubation is shown below the map. Small spots, corresponding to cytokines secreted by single responding cells, can be seen within the overall spot areas for two specific arrays; one is from the overlapping peptide series BZLF-1 [196–220] (green), and one is the previously identified minimal epitope BZLF-1 [198–210] (“QHY,” red). Surface plots for the boxed-array elements BZLF-1 [221–245] (nonactivating) and BZLF-1 [198–210] (activating) are shown below the array. Intensity spikes from individual secretion sources can be seen. (D) The average number of such spots observed for each element of the microarray in C is shown as a bar graph with the same layout (n = 4).

