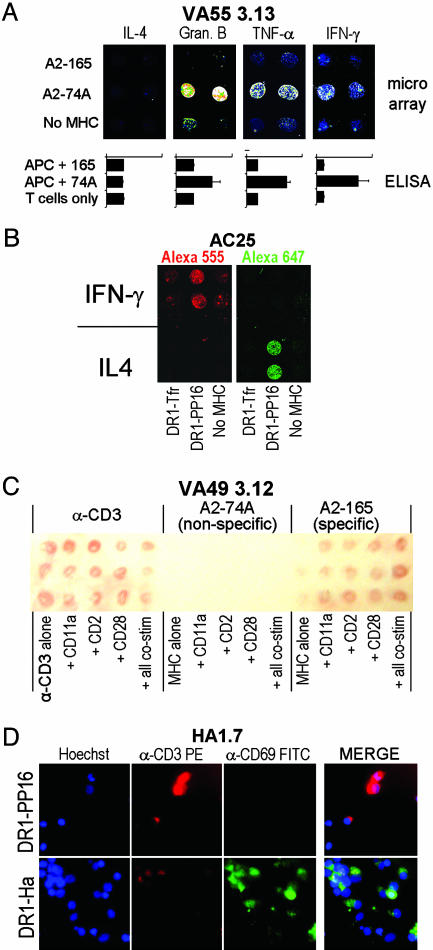
Fig. 5.
Analysis of multiple T cell functions. (A) A multichamber LabTek II CC2 slide was prepared with a different capture antibody in each chamber but with identical MHC–peptide and α-CD11a patterns. 2.5 × 10⁵ VA55 3.13 cells (specific to A2–74A) were incubated in each chamber for 6 h, and cytokine secretion was analyzed by using the appropriate detection antibody. Below each image is a bar graph showing the same cytokine detected by a bulk ELISA, where VA55 3.13 T cells are stimulated with peptide-pulsed, HLA-A2+ antigen-presenting cells. (B) A chip was spotted with α-IFN-γ- and α-IL-4-capture antibodies in different areas with the same MHC-peptide and α-CD11a stimuli coimmobilized. The chip was incubated for 6 h with 1 × 10⁶ AC25 T cells (specific to DR1–PP16) and then stained with a mixture of biotinylated α-IFN-γ preincubated with SA-Alexa Fluor 555 and biotinylated α-IL-4 preincubated with SA-Alexa Fluor 647. The chip was scanned at both wavelengths. Red, Alexa Fluor 555; Green, Alexa Fluor 647. (C) Cytokine capture can be detected on the arrays by using precipitating substrate. The array shown was incubated for 24 h with 2 × 10⁶ VA49 3.12 cells, a CD8+ T cell line specific to A2–165. IFN-γ secretion was detected in the regions containing α-CD3 and A2–165 but not A2–74A. (D) Cell-surface protein up-regulation in response to array elements can be detected by using fluorescently labeled antibodies. HA1.7, a CD4+ T cell clone specific to DR1–Ha, was incubated at 2.5 × 10⁶ cells per chamber for 16 h on a microarray containing DR1–PP16 (null; Upper) and DR1–Ha (activating; Lower). Hoechst nuclear stain shows the presence of adhering cells, whereas α-CD3-phycoerythrin and α-CD69-FITC were used to show the relative levels of those activation-linked cell-surface markers. A three-color merge for each stimulus is shown at the right.

