
Figure 6.
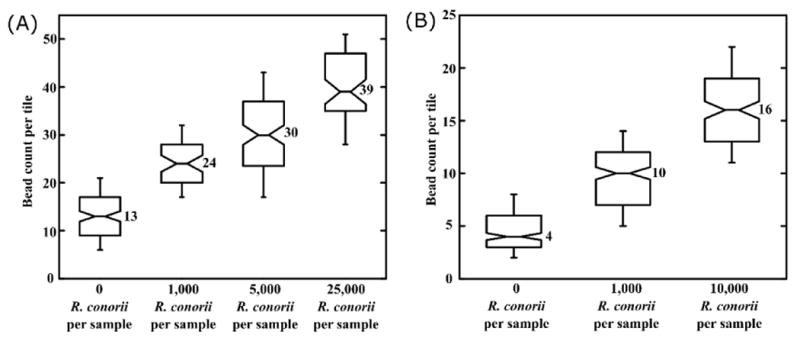
Assay results for R. conorii detection. (A) Notched box plots showing bead counts per tile for R. conorii detection using the Fc-mediated antibody immobilization strategy. (B) Notched box plots showing bead counts per tile for R. conorii detection using the PEGylation and amine-mediated antibody immobilization strategy. Horizontal lines on each box plot, from bottom to top beginning with the bottom whisker: 10th percentile, 25th percentile, median, 75th percentile, and 90th percentile. Non-overlapping notches imply significantly differing median values with 95% confidence. Box plots were generated using bead count per tile data from at least 3 independent experiments, with each experiment accounting for bead counts from 180 tiles.