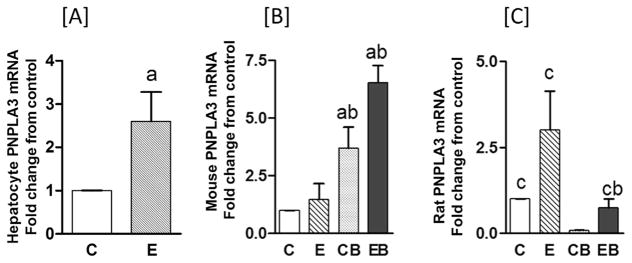
Fig. 2. qtPCR analysis of PNPLA3 rat hepatocytes [A], mouse [B], and rat [C] liver tissues.
Experimental details were as described in Materials & Methods and in Fig. 1. Values are mean ± S.E.M. (n = 3 hepatocyte experiments; n = 4 mice; n = 4 rats). a: significant compared to control (p < 0.05); b: significant compared to chronic (p < 0.05); and c: significant compared to control binge (p < 0.05). In [A] hepatocyte in vitro, C: Control, E: Ethanol. For in vivo treatments of mouse [B] and rat [C], C: Control (pair fed); E: Chronic ethanol; CB: Control binge ethanol; EB: Chronic ethanol followed by binge ethanol.

