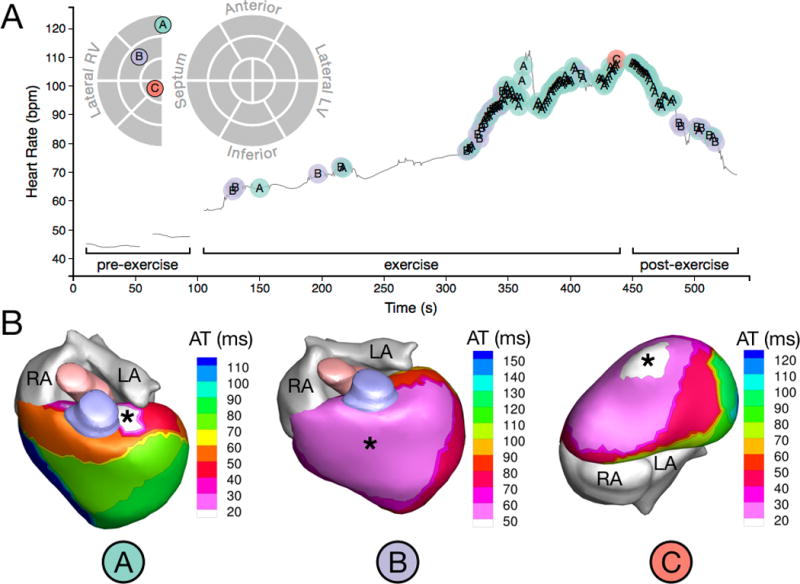
Figure 6.

PVC onset and initiation sites of a patient (Patient 6) with a high PVC burden (18.69%). (A) Time-course of observed PVCs in relation to exercise and schematic map of PVC initiation sites. The different PVC initiation sites are labeled A, B, and C and color coded. PVCs occurred only after the onset of exercise, and morphology C appeared only once near peak HR (B) Activation isochrone maps of the three distinct PVC morphologies observed in this patient. Asterisks indicate PVC initiation sites. Morphology B showed very a broad region of early epicardial activation, indicating a possible sub-epicardial origin and possible conduction system involvement. HR: heart rate.
