
Figure 1.
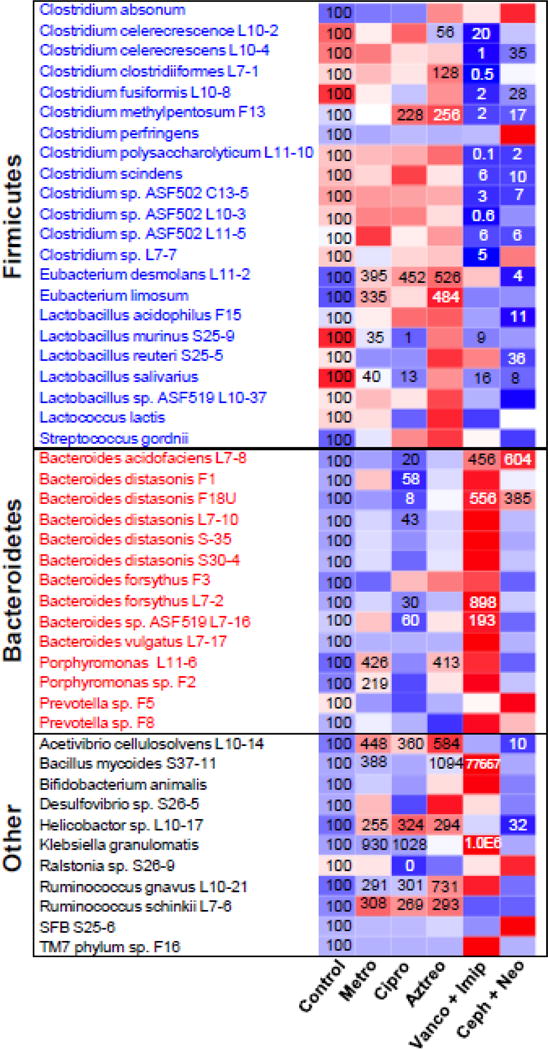
Heatmap presentation of antibiotic modulation of the intestinal microbiome. The heatmap was generated in R Bioconductor using the heatmap.2 function (omitting row and column dendrograms) of the gplots package. Data points statistically different (p<0.05) from control have the percent of control indicated within the heatmap square (control=100%). Red indicates an increased value, whereas blue indicates a decreased value.