
Figure 7. Knocking down MUC1 abrogates HIF-1α levels and increases gemcitabine sensitivity in Gem-R cells.
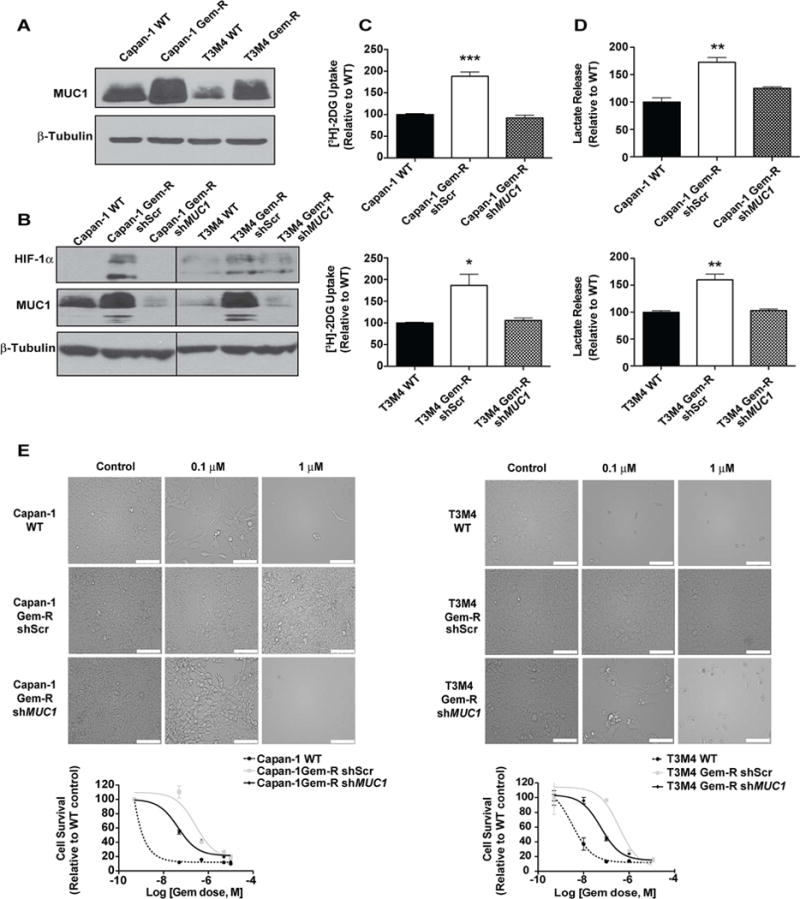
(A) Relative MUC1 expression in Gem-R vs. WT cells as determined by immunoblotting. (B) MUC1 and HIF-1α protein levels in WT, Gem-R and MUC1 knockdown Gem-R cells, as determined by immunoblotting. β-tubulin was used as a loading control. (C) Relative glucose uptake determined by [3H]-2DG uptake assays in MUC1 knockdown Gem-R as compared to scrambled controls of Gem-R and WT cells. Raw scintillation values were normalized to cell counts and depicted as percent of shScr WT controls. (D) Relative lactate release from shScr WT, shScr Gem-R and MUC1 knockdown Gem-R cells. Raw values were normalized to cell counts and plotted as percent of shScr WT controls. (E) Effect of MUC1 knockdown on gemcitabine sensitivity in Gem-R vs. WT cells as denoted by pictomicrographs and survival curves. Scale bars: 100 μm. Cell survival was measured by MTT assay after 72 hr gemcitabine treatment. Data in bar charts were compared by one-way ANOVA with Tukey’s post hoc analysis. For all in vitro studies, n=3 per sample. Data are represented as mean ± SEM. *p < 0.05, **p < 0.01, and ***p < 0.001.