
Figure 8. Reduced CTPS and TKT levels correlate with increased survival in human pancreatic cancer patients.
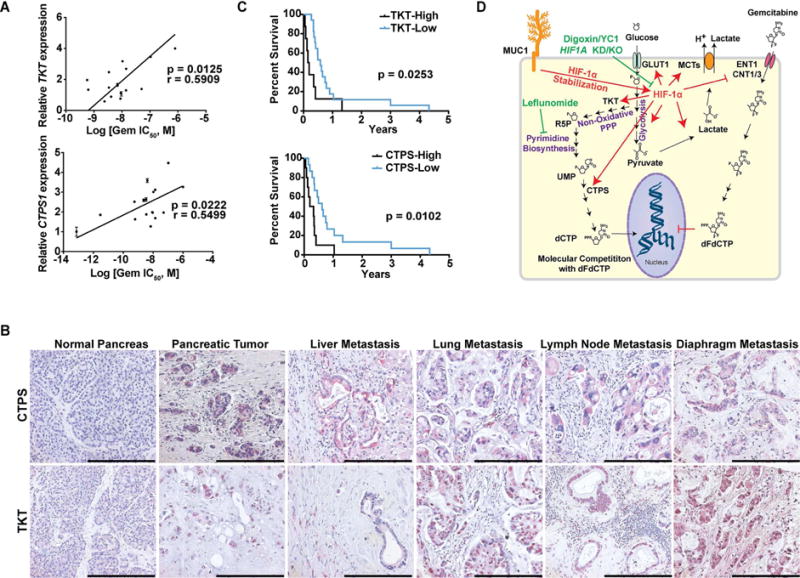
(A) Correlation of TKT and CTPS1 expression levels versus the IC50 of gemcitabine in 17 pancreatic cancer cell lines. ‘r’ depicts Pearson correlation value, and p values denote significance of correlation. (B) IHC staining of TKT and CTPS in formalin-fixed paraffin-embedded sections obtained from normal human pancreas, PDAC and metastatic lesions. Scale bars: 250 μm (C) Kaplan-Meier progression-free survival analysis of PDAC patients on gemcitabine/5-FU chemotherapy with high (above a composite score of 9; n=8 for TKT, n=10 for CTPS) or low (below a composite score of 9; n=17 for TKT, n= 15 for CTPS) TKT or CTPS expression levels based on IHC in pancreatic tumors. Comparisons were made by log-rank (Mantel-Cox) test and p values denote significance of alterations in survival in TKT or CTPS high- vs. low-expressing population. (D) Graphical summary for the metabolic basis of gemcitabine resistance in pancreatic cancer. Gemcitabine resistant cells demonstrate increased HIF–1α-mediated glucose uptake and, resultantly, increased flux of glucose through the PPP and pyrimidine biosynthesis to generate dCTP. Inhibition of HIF-1α or pyrimidine biosynthesis increases gemcitabine sensitivity in pancreatic cancer cells. R5P: Ribose-5-Phosphate; UMP: Uridine 5′-monophosphate; dCTP: Deoxycytidine 5′-triphosphate; dFdCTP: 2′,2′-Difluorodeoxycytidine 5′-triphosphate or Gemcitabine 5′-triphosphate. See also Table S1.