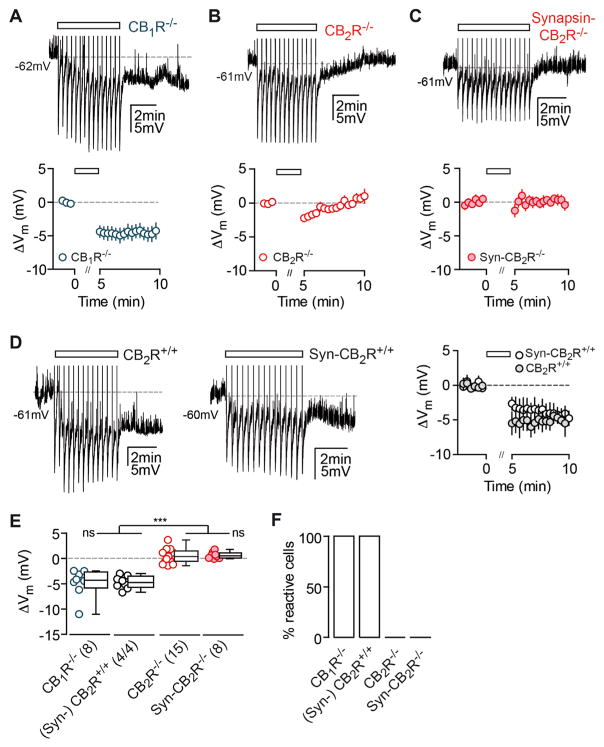
Figure 3. The Long-Lasting Hyperpolarization Is Absent in CB2R-Deficient Mice.
(A–C) AP trains (rectangle) induce a long-lasting hyperpolarization in CB1R−/− CA3 PCs (A), but not in CA3 PCs of CB2R−/− (B) and Syn-CB2R−/− mice (C). Left: exemplary pp recordings of KO CA3 PCs are shown. Right: summary time course shows the average ΔVm of CA3 PCs recorded from CB1R−/−: n(N) = 8(6), CB2R−/−: n(N) = 15(7), and Syn- CB2R−/−: n(N) = 8(5). The x axis is discontinued for the duration of the AP train.
(D) Same is shown as for (A)–(C) except for WT littermate controls of CB2R−/− and Syn-CB2R−/− mice: n(N) = 4(3)/4(2).
(E) The ΔVm of each recorded cell (circles) and the median and 25th and 75th percentiles of the average ΔVm (min 9–10) are shown for CA3 PCs recorded in CB1R−/− (−4.3, −5.8, and −2.6 mV), (Syn-)CB2R+/+ littermates (−4.7, −5.8 to −3.5 mV), CB2R−/− (0.39, −0.57 to 1.4 mV), and Syn- CB2R−/− (0.53, 0.086 to 1.1 mV). Kruskal-Wallis with Dunn’s post test, p < 0.0001 for [WT and CB1R−/−] versus [CB2R−/− and Syn-CB2R−/−]. The average ΔVm of WT versus CB1R−/− and CB2R−/− versus Syn-CB2R−/− did not differ significantly.
(F) Percentage of reactive cells are shown.

