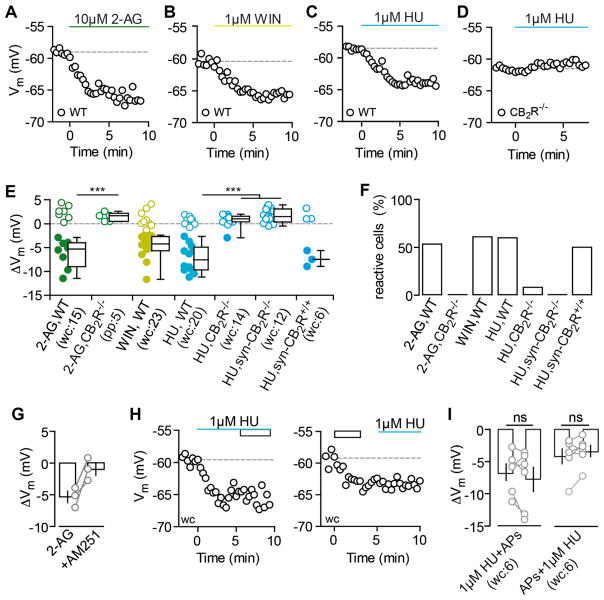
Figure 5. CB2R Agonists Mimic and Occlude the AP-Driven Hyperpolarization.
(A–D) Exemplary Vm time courses of wc CA3 PC recordings are shown for the application of 10 μM2-AG (A), 1 μM WIN (B), and 1 μM HU (C) that hyperpolarize CA3 PCs. The hyperpolarizing effect of HU is gone in the CB2R−/− (D).
(E and F) The ΔVm of each recorded cell (circles) and the median and 25th and 75th percentiles of the average ΔVm (E) as well as the percentage of reactive cells (F) are shown for the application of 2-AG in WT (wc, n(N) = 15(5): −5.3, −9.0 to −3.9 mV; 53.3%) and in CB2R−/− (pp, n(N) = 5(2): 1.6, 0.5 to 2.2 mV; 0%), WIN in WT (wc, n(N) = 23(15): −4.2, −5.6 to −2.7 mV; 60.9%), HU in WT (wc, n(N) = 20(10): −7.6, −9.7 to −4.9 mV; 60%), HU in CB2R−/− (wc, n(N) = 12(3): 0.9, 0.3 to 1.5 mV; 8.3%), HU in Syn-CB2R−/− (wc, n(N) = 14(5): 1.4, 0.3 to 3 mV, 0%), and HU in Syn-CB2R+/+ (wc, n(N) = 6(4): −7.5, −9 to −5.7 mV; 50%). Note that the filled circles indicate reactive cells. Green, 2-AG; yellow, WIN; blue, HU. Kruskal-Wallis with Dunn’s post-test, p < 0.05 for 2-AG and HU in CB2R−/− versus WT.
(G) AM-251 reverses the hyperpolarization induced by 2-AG in n(N) = 3(3) CA3 PCs (−5.3 ± 0.9 mV and −0.9 ± 1 mV, respectively).
(H) The HU-induced hyperpolarization (blue line) occludes further hyperpolarization of CA3 PCs in response to APs (rectangle) and vice versa. Exemplary ΔVm time courses of CA3 PCs that hyperpolarize in response to HU (left) and AP trains (right) are shown.
(I) Single-occlusion experiments (gray circles) and mean ± SEM (black) are shown for each condition. Average ΔVm for HU followed by APs (left, n(N) = 6(4): −6.6 ± 1.3 and −7.8 ± 1.9 mV; paired t test, p = 0.24) and APs followed by HU (right, n(N) = 6(6): −4.2 ± 1.2 and −3.4 ± 0.9 mV, p = 0.19).

