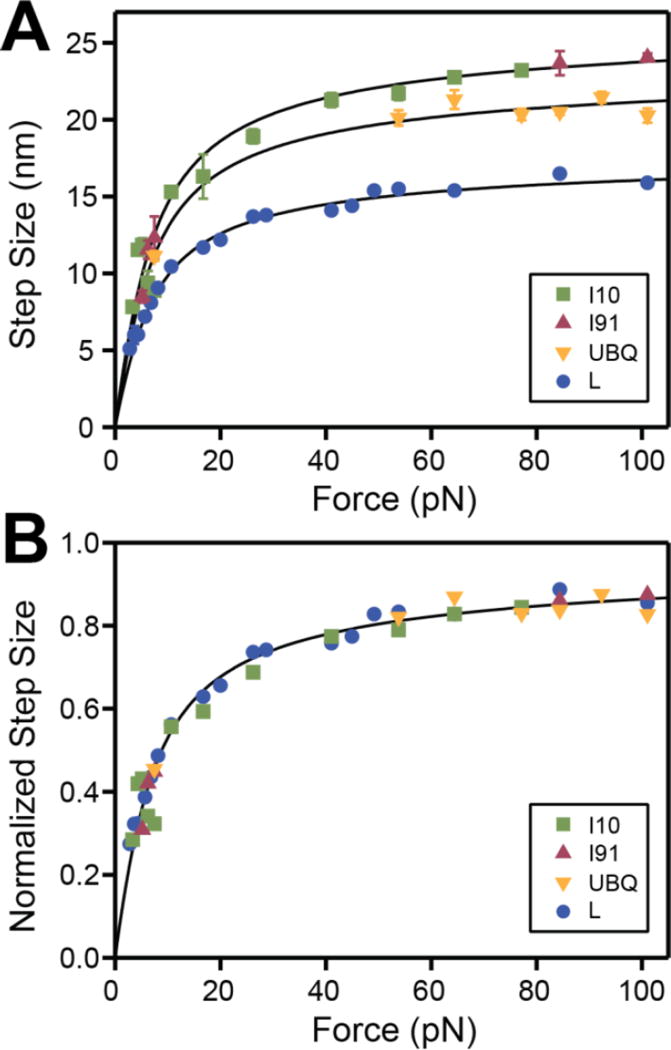
Figure 5. Size dependency of the folding transitions as a function of force for different proteins.
A) Measured size of the unfolding and refolding steps as a function of force for I10 (green squares), I91 (red triangles), ubiquitin (orange triangles) and protein L (blue circles). The lines represent the behavior predicted by the worm-like chain (WLC) model, using a persistence of 0.58 nm and the contour length increments from Figure 2. B) The same data-points as in A, normalized for each protein to the specific contour length increment. The points collapse on a master curve that can be described by a WLC model (black line).

