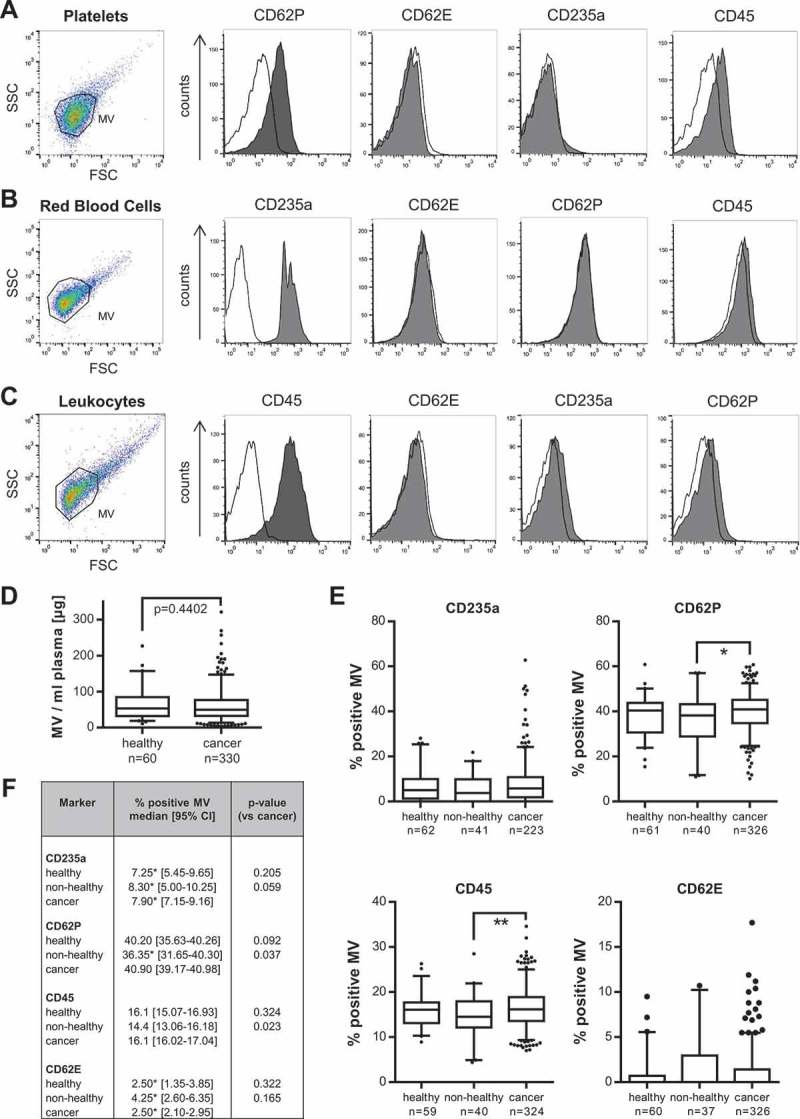
Figure 2.

Comparison of blood-cell-derived MV in cancer and control patients. (a–c) Flow cytometry analysis of specific markers for MV isolated from red blood cells, platelets and leukocytes (macrophages) (CD235a, CD62P, CD45: grey filled; respective isotype control: black line) (n = 3). (d) MV concentrations per ml plasma were determined by quantification of MV protein yield. (e) Flow cytometry: Comparison of the percentage of CD235a-, CD62P-, CD45- and CD62E-positive MV in blood from either cancer patients or healthy and non-healthy controls (*p = 0.037, **p = 0.023, two-sided t test). Boxplots depict the median (line), the 25–75 percentiles (box) and the 10–90 percentiles (whiskers). (f) Summary of the analysis of blood-cell-derived MV by flow cytometry. Significance was calculated with a two-sided t test or Wilcoxon rank sum test, as appropriate. *Indicates median calculation with [23].
