
Figure 5.
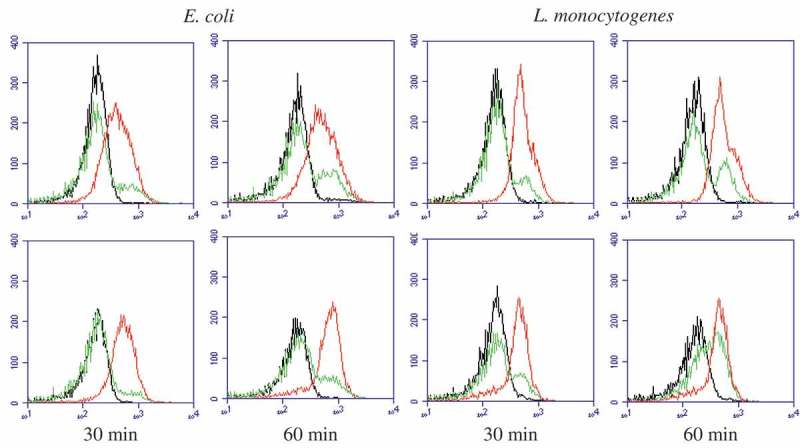
Flow cytometry images of E. coli and L. monocytogenes respectively treated with eugenol (upper panel) and isoeugenol (lower panel) for 30 min and 60 min. Black line, control; green line, 1 × MIC; red line: 2 × MIC.
Official websites use .gov
A
.gov website belongs to an official
government organization in the United States.
Secure .gov websites use HTTPS
A lock (
) or https:// means you've safely
connected to the .gov website. Share sensitive
information only on official, secure websites.
Flow cytometry images of E. coli and L. monocytogenes respectively treated with eugenol (upper panel) and isoeugenol (lower panel) for 30 min and 60 min. Black line, control; green line, 1 × MIC; red line: 2 × MIC.