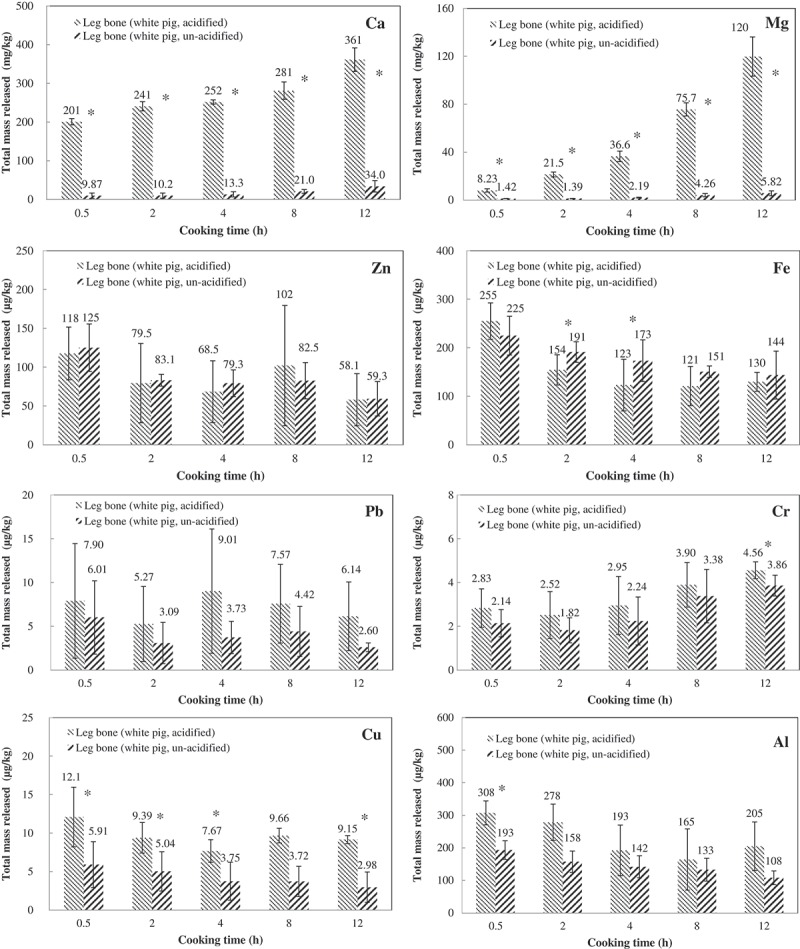
Figure 1.

Total amounts released for each metal across different sampling time points between acidified and unacidified broths. The numbers shown are means of triplicate measurement and error bars are standard deviations. The asterisk indicates statistically significant difference (p < 0.05, paired t-test) between the two broths.
