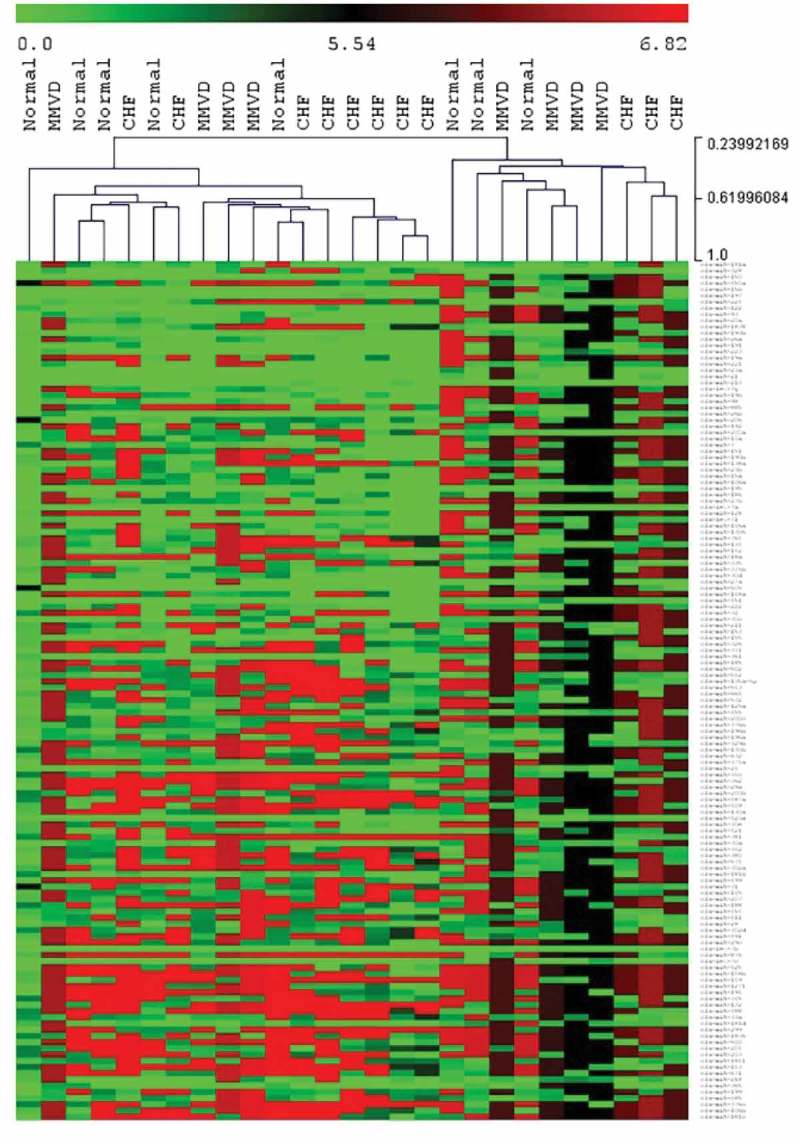
Figure 1.

Hierarchical clustering heat map for total plasma miRNA. Hierarchical clustering using normalised Cq number for total plasma miRNA expression (green = higher expression, red = lower expression) comparing normal dogs, dogs with myxomatous mitral valve disease (MMVD) and dogs with heart failure due to MMVD (CHF).
