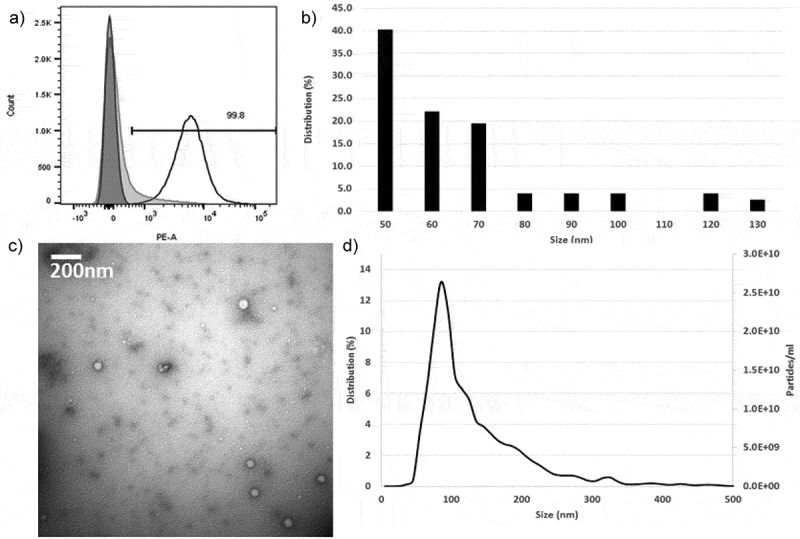
Figure 2.

Characterisation of plasma exosomes. (a) Flow cytometry profile of CD9-positive exosomes showing 99.8% of the beads are positive for CD9 (dark grey = latex beads alone, light grey = IgG2b isotype, white = isolated exosomes). (b) Representative transmission electron microscopy (TEM) micrograph of exosomes. (c) TEM size distribution out of a total of 77 exosomes counted. (d) Nanoparticle tracking analysis analysis of microvesicle size distribution.
