
Figure 5.
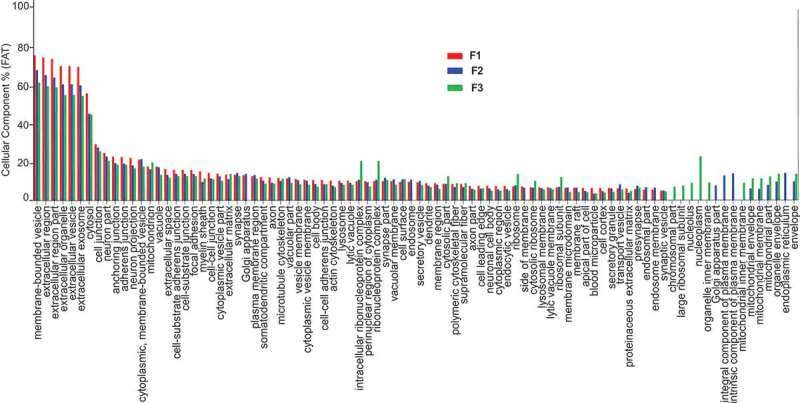
Analysis of cellular component GO terms. The proteins common to each fraction were grouped using gene ontology (GO) terms related to cellular component analysis process using DAVID [19]. The graph shows the percentage of proteins identified by mass spectrometry that fall into the designated GO category relative to the total number of proteins in the category. GO FAT was used to minimize the redundancy of general GO terms in the analysis. A modified Fisher’s exact p-value was used to demonstrate gene ontology, where p-values less than 0.05 after Benjamini multiple test correction were considered enriched in the category. A count threshold of 5 and default value of 0.05 for the enrichment score was used. Categories with enrichment greater than 5.5% are shown.