
Figure 6.
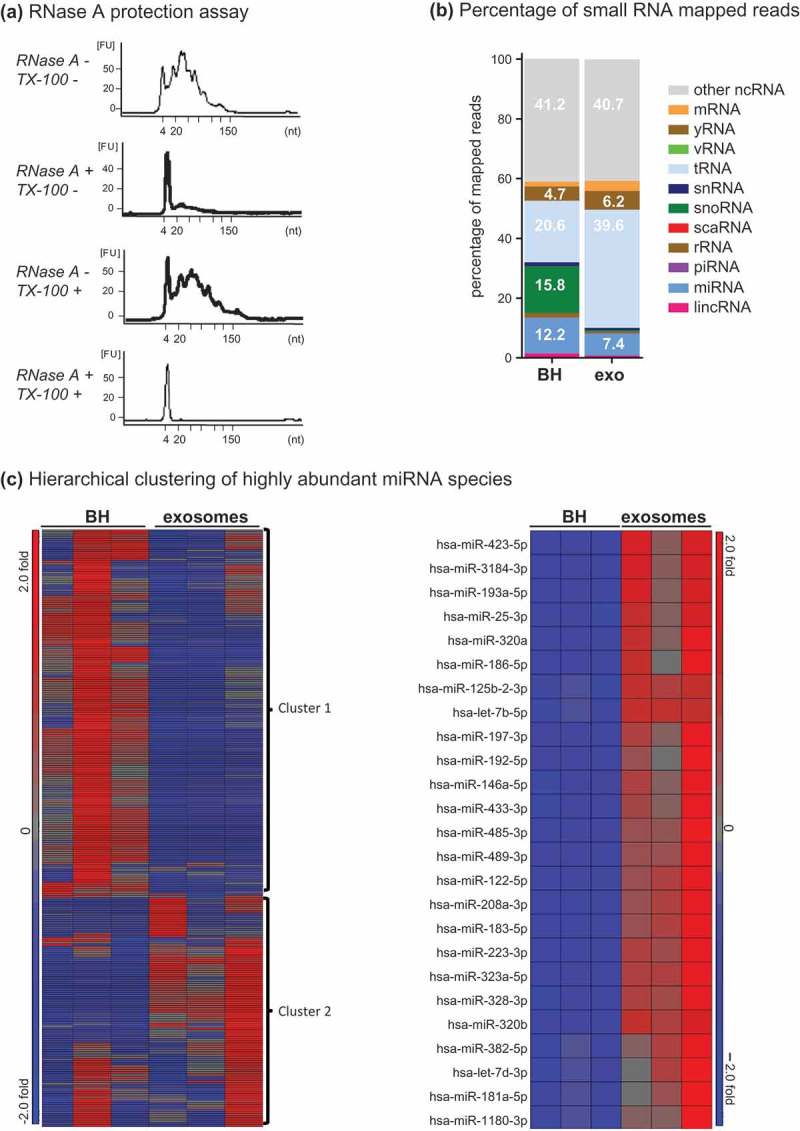
Small RNA analysis of Fraction 2. (a) Bioanalyser analysis of small RNA associated with Fraction 2. Fraction 2 was treated with or without Triton-X 100 and or RNase A for 30 min, RNA was extracted and analysed on a small RNA chip which was submitted for bioanalysis. miRNA is between 4 and 22 nt in length. The peak visualized at 4 nt is the marker peak. (b + c) Analysis of RNase A-treated small RNA. Raw sequencing reads were aligned to the human genome (HG19) and mapped to miRBase V.20 and other small RNA from Ensembl Release 17 followed by normalization of raw reads to reads per million (RPM). The mean of reads per miRNA (n = 3) was calculated. (b) The percentage of total reads mapped to non-coding small RNA and other RNA species identified by small RNA deep sequencing. (c) Left panel, unsupervised hierarchical clustering of highly abundant miRNA species (>10 RPM) identified in BH and F2 (n = 3, all groups). Cluster 1 miRNAs are enriched in BH and cluster 2 miRNAs are enriched in F2. Right panel, unsupervised hierarchical clustering of the top 20 miRNA detected in F2. Red indicates high expression and blue indicates low expression.