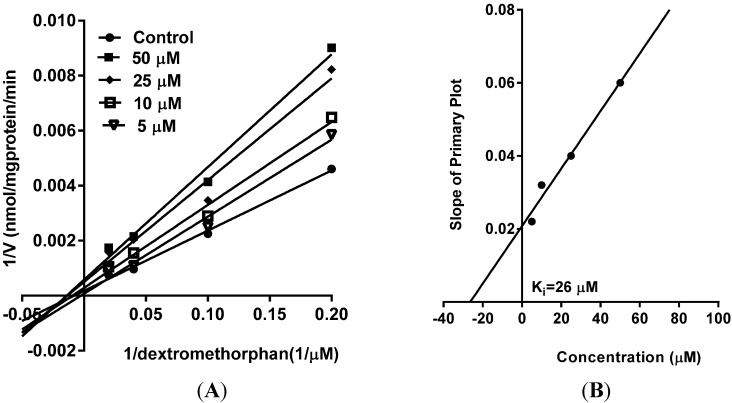
Figure 4.
(A) Primary Lineweaver-Burk Plot of CYP2D6 inhibition (competitive) by vinpocetine in HLM; (B) Inhibition constant (Ki) was determined by plotting the slope of the Primary Lineweaver-Burk Plot versus the concentration of vinpocetine. The data are represented as mean ± SD of triplicate incubations in HLM.

