
Figure 1.
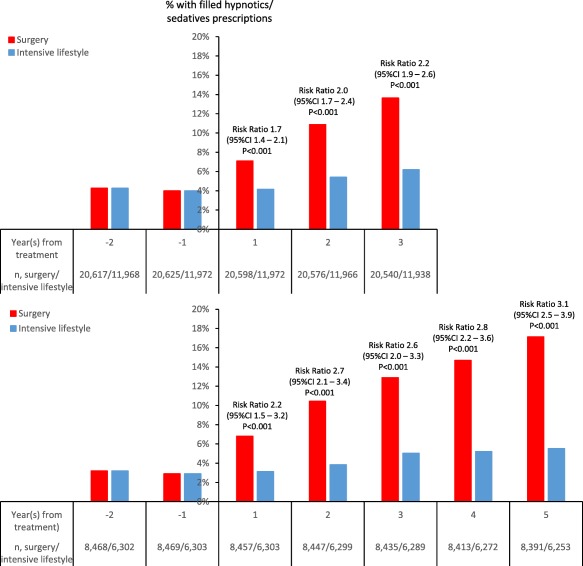
Proportion of patients with filled hypnotics and/or sedatives prescriptions in the matched study population with 3 years of follow‐up (upper panel) and in the subgroup with 5 years of follow‐up (lower panel). Risk ratios (95% CI) apply to the between‐cohort differences at each follow‐up time point. Baseline characteristics of subgroups with 5 years of follow‐up are shown in Supporting Information Table S3. The proportion of patients with filled hypnotics and/or sedatives prescriptions in the unmatched study population is shown in Supporting Information Figure S4. [Color figure can be viewed at wileyonlinelibrary.com]