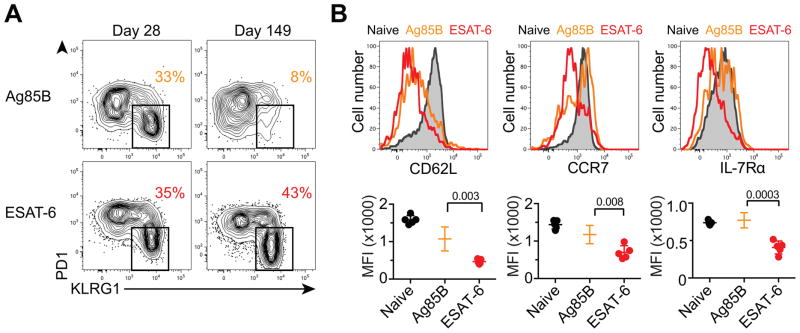
Figure 2. Chronic antigenic stimulation drives murine Mtb-specific CD4 T cells towards terminal differentiation.
(A) PD1 and KLRG1 expression on Ag85B and ESAT-6-specific CD4 T cells in the lung. The percentage of KLRG1+ cells is shown.
(B) CD62L, CCR7 and IL-7Rα expression on lung naïve, Ag85B-specific, or ESAT-6-specific CD4 T cells at 103 days post-infection. Graphs depict the mean fluorescence intensity (MFI) for individual mice. See also Figure S3.

