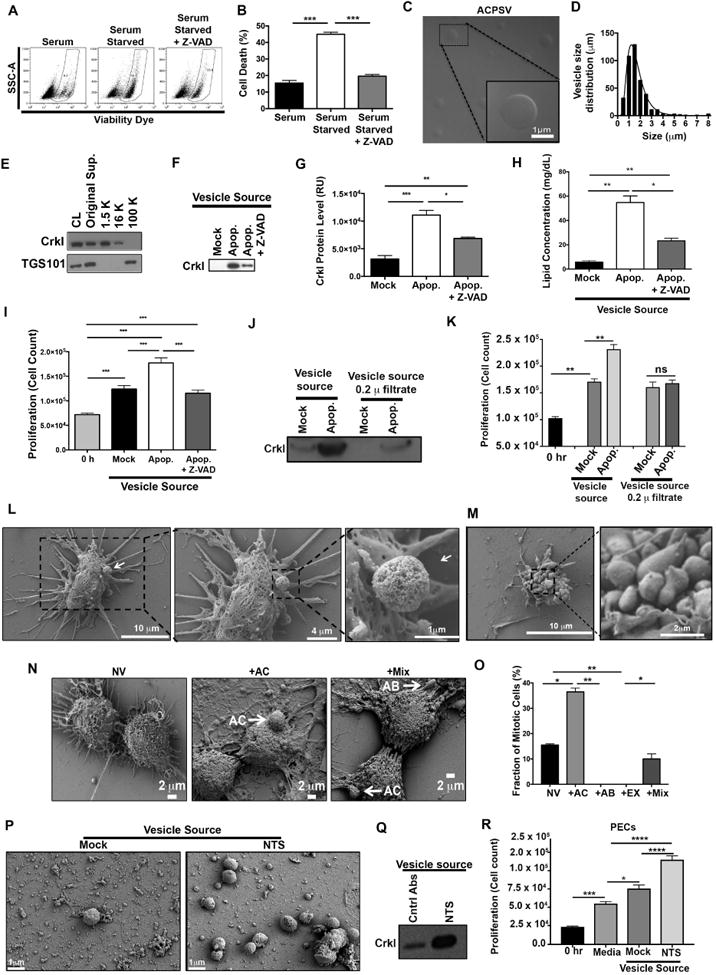
Fig. 2. Purification and characterization of CrkI-containing microvesicles (ACPSVs).

(A) HeLa cells either received 10% serum (Mock) or were induced to undergo apoptosis by serum-starvation in the presence or absence of Z-VAD. 24h after serum starvation, apoptotic cell death was assessed by flow cytometry and the tabulated results from 3 independent experiments are shown in (B). (*** p<0.001, One-way ANOVA). (C-I) Supernatants from the indicated cultures were fractionated by differential centrifugation and evaluated for their CrkI-containing microvesicles (ACPSVs) and CPS. (C) ACPSVs in the 16K fraction of apoptotic cells were visualized by DIC. (D) Vesicle size distribution was determined and plotted (Mean size ± S.D. = 1.76 ± 1.04 μm, n=822). (E) Peptides from the cell lysate (CL) and the indicated fractions of serum-starved apoptotic cells were probed for TGS101 (exosome marker) and CrkI (ACPSV marker) by Western blotting. (F) The 16K fractions of healthy (Mock), serum-starved (Apop.) and Z-VAD treated serum-starved (Apop. + Z-VAD) were probed for ACPSV content by Western blotting of CrkI and the results from 6 independent studies were plotted in (G). (* p<0.05, ** p<0.01, *** p<0.001, One-way ANOVA). (H) The lipid contents of the vesicles in the 16K fractions of the indicated cultures were measured and the tabulated data from 3 experiments are shown. (* p<0.01, ** p<0.005, One-way ANOVA). (I) HeLa cells were treated with 16K fractions of serum-fed healthy (Mock), serum-starved apoptotic (Apop.), or Z-VAD treated serum-starved (Apop. + Z-VAD) and the proliferation levels were determined by cell count 24h after treatment. The tabulated data from n≥6 independent experiments are shown as the Mean ± S.D. (*** p<0.001, One-way ANOVA). (J-K) The 16K fractions of mock and apoptotic (apop.) HeLa cells were passaged through 0.2 μ filter to remove vesicle. (L-M) HeLa cells were seeded on a coverslip and induced to undergo apoptosis by serum-starvation. 24h after serum starvation, cells were fixed and analyzed by SEM. (L) Representative images of a vesicle producing cell are shown. (M) Representative images of an apoptotic body-producing cell are shown. (N-O) Original supernatant from serum-starved apoptotic HeLa cell culture was spun down at 100,000× g (100K) to collect all vesicles, which were then added to adherent HeLa cells on a coverslip. Five hours after vesicle addition, the fractions of mitotic cells, with no vesicle (NV); with ACPSV only (+AC); with apoptotic body only (+AB); or with a combination of vesicles (+Mix) were assessed by SEM. Selected images representing each group is shown in (N) and the tabulated data from 3 experiments are shown in (O). (** p ≤ 0.01, *** p ≤ 0.001, **** p ≤ 0.0001; One-way ANOVA). (P-Q) C57BL/6 mice were injected with nephrotoxic serum (NTS) to induce nephritis or isotype antibody control (Mock). Vesicles were harvested from mock and NTS-injected mice glomeruli and imaged by SEM (P) and evaluated for their CrkI contents by Western blot (Q), and for their ability to induce proliferation in adherent kidney parietal epithelial cells (PECs) in (R). (3 independent experiment, 4 mice/group, each group was done in triplicates, * p<0.05, *** p<0.001, **** p<0.0001, One-way ANOVA).
