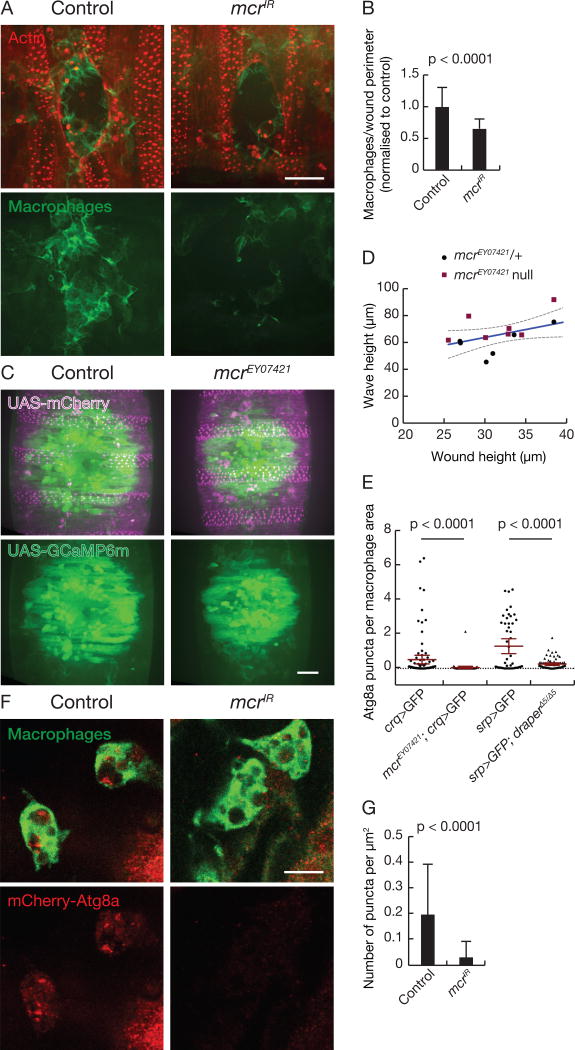
Figure 6. Mcr is required in a cell non-autonomous manner for macrophage recruitment to wounds.
(A) Epithelial-driven mcrIR reduces recruitment of stage 15 embryonic macrophages to laser-induced wounds compared to control. Z-projection of macrophage recruitment to laser-induced wounds 60 minutes post-wounding. Macrophages (green) can be seen around the wound edge of the epithelium (red). Scale bar, 20 µm.
(B) Number of macrophages at the wound edge per µm of wound perimeter normalized to control (n ≥ 22). Error bars, SD; Statistical significance: unpaired t-test with Welsh correction.
(C) Wound-induced calcium wave is not affected in mcr mutants. Still images of calcium wave (green) around the wound edge of the embryonic epithelium (magenta) immediately after wounding. Scale bar 20 µm.
(D) Wound height versus height of calcium wave was calculated for both heterozygous embryos (black circles) and homozygous mcr mutant embryos (red squares).
(E) mCherry-Atg8a puncta in stage 15 embryonic macrophages are reduced in mcr and drpr mutants. Number of mCherry-Atg8a puncta per macrophage cell normalized to cell area (n ≥ 49 macrophages and n ≥ 4 embryos per treatment). Error bars, 95% CI; Statistical significance: Kolmogorov-Smirnov test.
(F) Epithelial-driven mcrIR reduces mCherry-Atg8a puncta in stage 15 embryonic macrophages. Single Z-slice of macrophages (green) and mCherry-Atg8a puncta (red) in control and epithelial-driven mcrIR. Scale bar, 10 µm.
(G) Number of mCherry-Atg8a puncta per cell normalized to cell area (n ≥ 226 macrophages, n ≥ 10 embryos). Error bars, SD; Statistical significance: Mann-Whitney test.
See also Figure S5.

