
Figure 12.
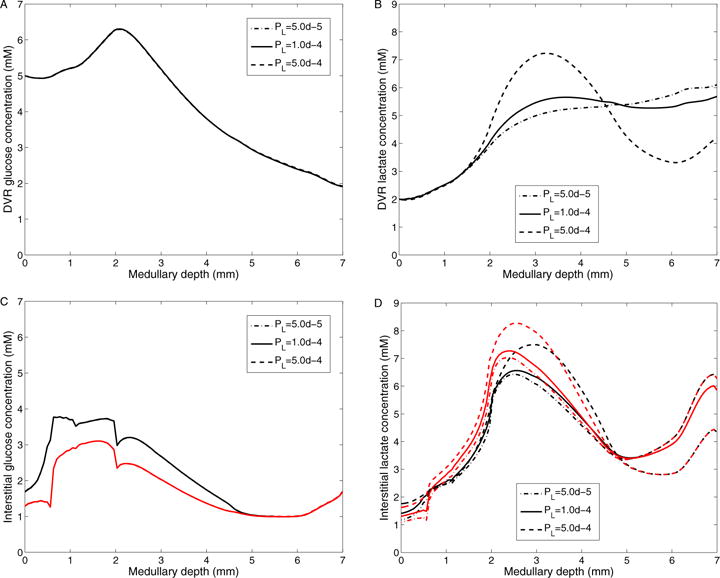
Results for varying DVR lactate permeability. A: DVR glucose concentrations; B: DVR lactate concentrations; C: Interstitial R1 (black) and R4 (red) glucose concentrations; D: Interstitial R1 (black) and R4 (red) lactate concentrations; Obtained for DVR lactate permeabilities of 5 × 10⁻⁵, 10−4 (baseline), and 5 × 10⁻⁴ cm/s.