
Figure 9.
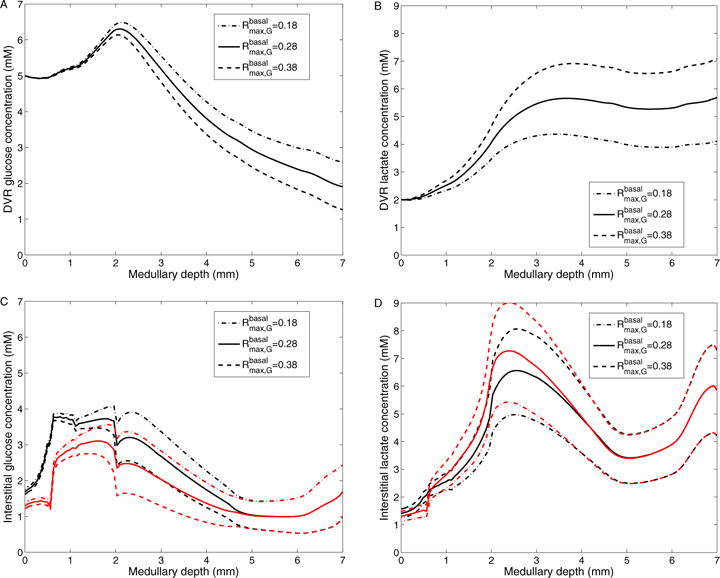
Results for varying maximum rate of basal glucose metabolism. A: DVR glucose concentrations; B: DVR lactate concentrations; C: Interstitial R1 (black) and R4 (red) glucose concentrations; D: Interstitial R1 (black) and R4 (red) lactate concentrations; Obtained for of 0.18, 0.28 (baseline), and 0.38 mM/s.