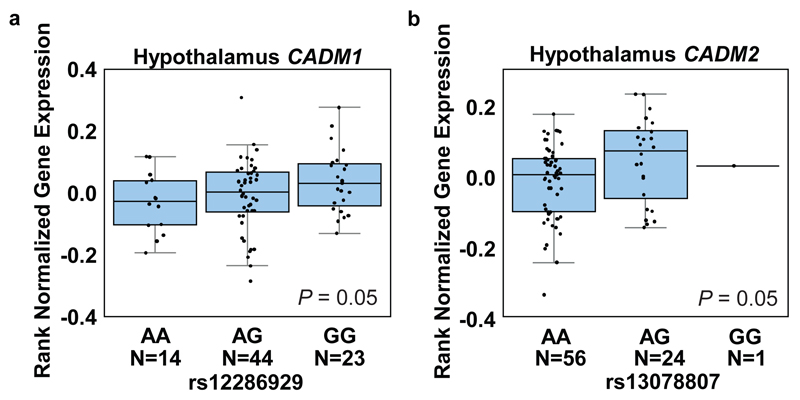
Figure 1.
BMI risk SNPs associate with increased CADM1 and CADM2 expression in the hypothalamus of human subjects. Boxplots show the 25% and 75% quantiles of normalized mRNA expression levels (y-axis), solid horizontal lines indicate the median, and whiskers indicate the 10% and 90% quantiles. (a) Elevated expression of CADM1 associates with risk allele (G) of rs12286929 in hypothalamus. (b) Genotype dependent expression levels of CADM2 for the SNP rs13078807. The risk allele (G) is associated with higher expression levels in human hypothalamus. Statistical analyses are described in the Methods and Supplementary Table 3.

