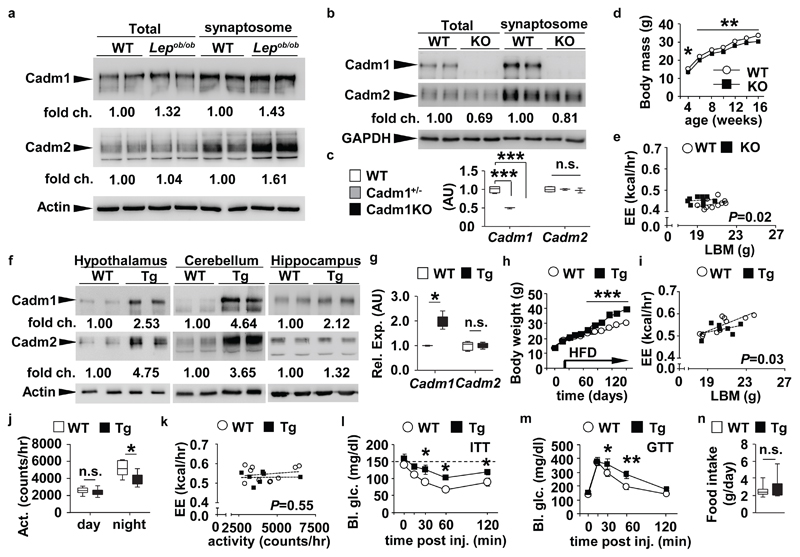
Figure 2.
Induction of Cadm1 in excitatory neurons increases body weight. (a) Western blot analysis of Cadm1 and Cadm2 in total and synaptosome-enriched lysates from hypothalamus of 4-week-old Lepob/ob mice and littermate controls. (b) Western blot analysis of Cadm1 and Cadm2 in total and synaptosome-enriched lysates from hippocampus of 3-week-old Cadm1KO and control littermates. (c) qRT-PCR analysis of Cadm1 and Cadm2 expression in hippocampus of 5-week old Cadm1KO mice, Cadm1−/+ (heterozygous) and control littermates (WT) (n=3-4). (d) Body weight curves of Cadm1KO mice (n=10) and littermate controls (n=10). (e) Energy expenditure of individual animals plotted against lean body mass (LBM) in 12-week old Cadm1KO (n=9) and littermate controls (n=10). (f) Western blot analysis of Cadm1 and Cadm2 in total lysates from hypothalamus, cerebellum, and hippocampus of 14-week-old Tg-Cadm1 mice and control littermates. (g) Quantification of Cadm1 and Cadm2 expression from cultured primary hippocampal neurons from Tg-Cadm1 mice (n=5) and wild-type littermate controls (n=5) after 5 days of treatment with doxycycline. (h) Body weight curves of Tg-Cadm1 mice (n=5) and littermate controls (n=8) upon doxycycline treatment at 4 weeks of age. High fat diet feeding was initiated on day 25 of doxycycline treatment. (i) Energy expenditure of individual animals plotted against lean body mass (LBM) in 16-week old Tg-Cadm1 mice (n=7) and littermate controls (n=10). (j) Quantification of locomotor activity measured in 16-week old Tg-Cadm1 mice (n=7) and controls (n=8). (k) Energy expenditure of individual animals plotted against locomotor activity in 16-week old Tg-Cadm1 mice (n=7) and littermate controls (n=10). (l) Blood glucose measurements during an insulin tolerance test (ITT) on 20-week old Tg-Cadm1 mice (n=5) and control littermates (n=6). (m) Glucose measurements during a glucose tolerance test (GTT) on 18-week old Tg-Cadm1 mice (n=5) and littermates (n=7). (n) Quantification of food intake in 16-week old Tg-Cadm1 mice (n=7) and littermates (n=8). All results are presented as mean ± s.e.m. *P<0.05, ** P<0.01, *** P<0.001. Boxplots show median, lower and upper quartiles (box), and minimum and maximum (whiskers). Statistical analyses are described in the Methods and Supplementary Table 3.

