Figure 6.
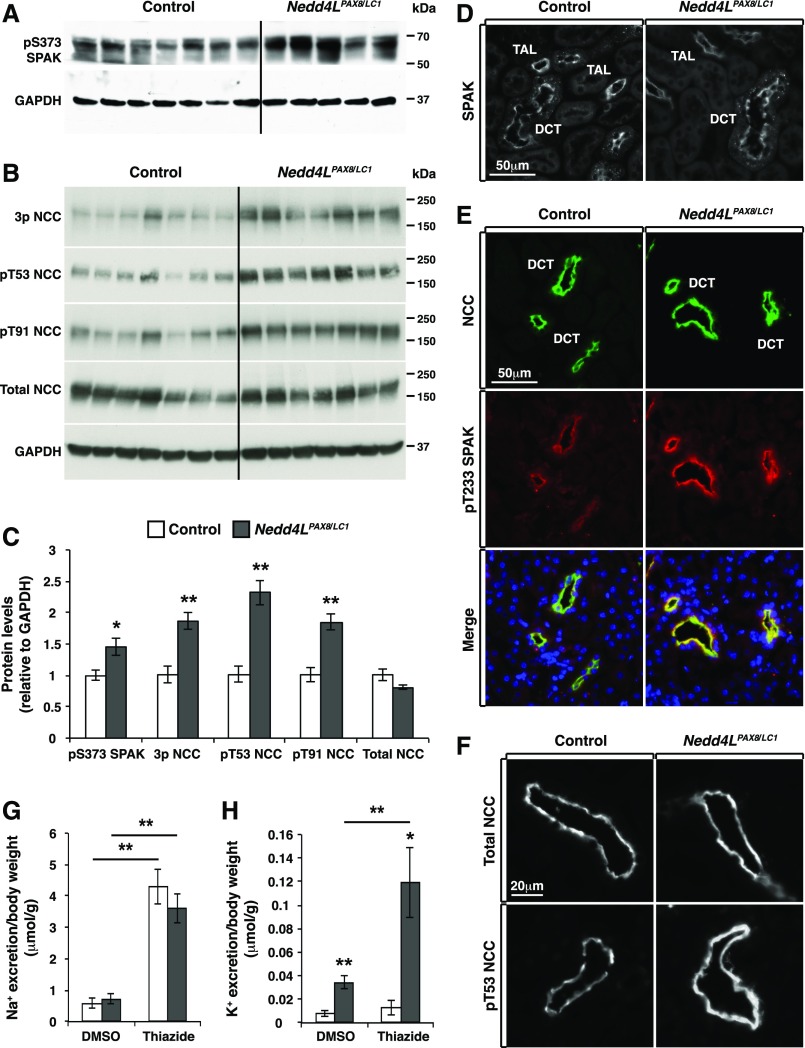
NCC and SPAK phosphorylation is increased in Nedd4LPax8/LC1 mice after 2 weeks of LKD. (A and B) Western blot analysis of SPAK (A) and NCC (B) phosphorylation in control and Nedd4LPax8/LC1 mice. (C) Protein quantification from (A) and (B) showing a significant increase in S373 phosphorylated SPAK and NCC phosphorylation at several residues including T53, T91, or the combination of T43, T53, and T58 (3P-NCC), with no modification of total NCC (seven controls and five to seven Nedd4LPax8/LC1 mice). (D) Immunostaining of total SPAK in control and Nedd4LPax8/LC1 mice showing comparable level and localization of the protein in the cortex of both genotypes. (E) Costaining of NCC (green) and T233 phosphorylated SPAK (red) in control and Nedd4LPax8/LC1 mice. An increase in SPAK phosphorylation was observed in the DCT of mutant mice. (F) Immunostaining of total (upper panel) and T53 phosphorylated NCC (lower panel) in control and Nedd4LPax8/LC1 mice after 2 weeks of LKD. Increased NCC phosphorylation is observed in Nedd4LPax8/LC1 mice, with similar apical localization of the transporter in both genotypes. (G and H) Thiazide treatment induced an equivalent increase in Na+ excretion in control and Nedd4LPax8/LC1 mice compared with vehicle (DMSO) (G), whereas K+ excretion was exacerbated in mutant mice by thiazide treatment (H) (seven mice in each group). *P<0.05; **P<0.01.

