Figure 7.
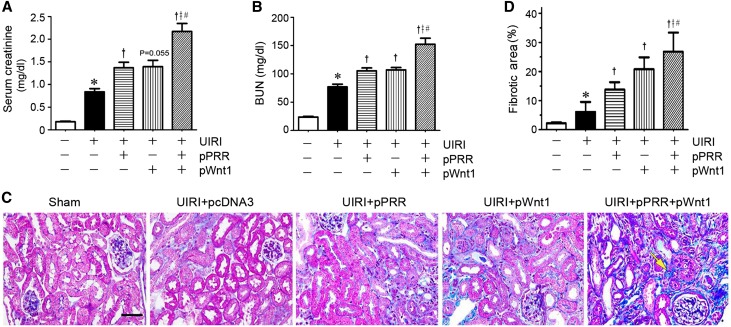
PRR and Wnt1 synergistically aggravate kidney dysfunction and fibrosis after IRI. (A) Over-expression of PRR and Wnt1 expression vector starting at 4 days after IRI aggravated kidney dysfunction. Serum creatinine (A) and BUN (B) were assessed at 11 days after UIRI. *P<0.05 versus sham; †P<0.05 versus UIRI injected with pcDNA3; ǂP<0.05 versus UIRI injected with pCMV-PRR; #P<0.05 versus UIRI injected with pHA-Wnt1 (n=6). The P value (0.06) between UIRI group and UIRI plus pHA-Wnt1 was given. (C) Representative micrographs showed collagen deposition in different groups as indicated. Paraffin sections were subjected to MTS. Yellow arrow indicates positive staining. Scale bar, 50 μm. (D) Graphical presentation demonstrated kidney fibrotic lesions after quantitative determination. *P<0.05 versus sham; †P<0.05 versus UIRI injected with pcDNA3; ǂP<0.05 versus UIRI injected with pCMV-PRR; #P<0.05 versus UIRI injected with pHA-Wnt1.

