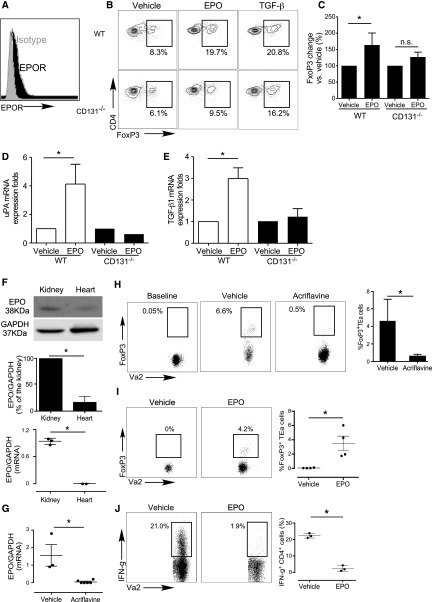
Figure 2.
EPO promotes in vivo murine antigen-specific Treg generation. (A) Representative flow plot (of four individual experiments) depicting EPO-R expression gated on naïve murine B6 CD4+ T cells (black). Isotype control staining is shown in gray. (B and C) Murine naïve B6 CD4+ T cells were stimulated with WT or CD131−/− B6 APCs, anti-CD3 mAb, and IL-2 with or without EPO, with or without TGFβ for 5 days. (B) Representative flow plots (gated on CD4+ T cells) and (C) quantification of Foxp3 expression (n=3). (D and E) TGFβ1 (D) and uPA (E) gene expression in murine B6 WT or CD131−/− monocytes treated with EPO or vehicle control for 24 hours analyzed by qRT-PCR, representative of two independent experiments. (F) Lysates of BALB/c kidney and heart tissue were tested for EPO by immunoblot (immunoblots for GAPDH verified equal amounts of protein added to each lane). Representative of three independent experiments (top panel) and data quantification (middle panel). Lower panel shows results of qRT-PCR for EPO gene mRNA expression obtained from the same organs used for immunoblotting. (G) BALB/c mice were treated with acriflavine (2 mg/kg per day, administered intraperitoneally) or vehicle for 7 days and kidneys were harvested, RNA isolated, and EPO gene expression analyzed by qRT-PCR (n=3 per group). (H) Foxp3GFPneg CD4+ TEa cells (left panel) were injected into B6rag1−/− mice on day 2 after transplantation of a kidney from control- or acriflavine-treated BALB/c donors (recipient native kidney left in place, no acriflavine was administered post-transplant). Representative flow plots gated on CD4+ T cells in the spleen as indicated and summarized quantified results (n=3 per group) obtained on day 3 after transfers, showing Foxp3 and Vα2+ (TEa is Vα2+). (I) Foxp3GFPneg CD4+ TEa cells (>99% purity) were injected into B6rag1−/− mice on day 2 after transplantation of a BALB/c heart. Recipients were given EPO (1000 IU/kg per day) or vehicle control for 5 days. Representative flow plots gated on CD4+ T cells in the spleen (left) and summarized quantified results (right; n=3 per group) obtained on day 5 after transfers, showing Foxp3 and Vα2+ (TEa is Vα2+). (J) Intracellular IFNγ expression (flow cytometry) in splenocytes from the same animals of (I) reactivated ex vivo with TEa peptide 52–68 (100 μM) for 4 hours. Representative flow plots gated on CD4+ T cells and summarized quantified results of IFNγ-producing cells (n=3 per group). *P<0.05.

