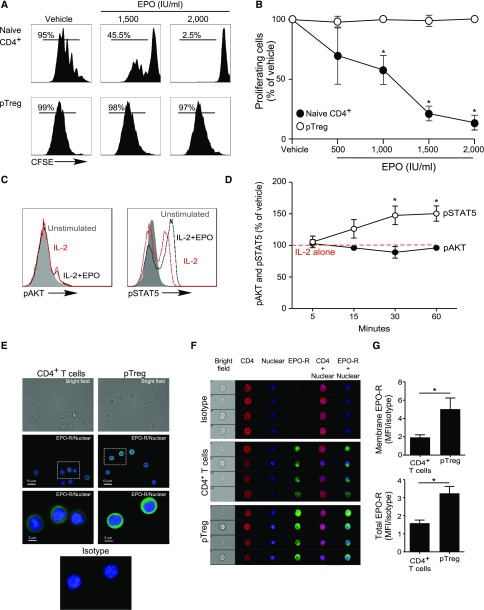
Figure 4.
EPO inhibits proliferation of human Tconv but not Treg. (A and B) CFSE-labeled naïve human CD4+ T cells and ex vivo expanded Treg were activated with anti–CD3- and anti–CD28-coated beads (25 μl/106 cells) and IL-2 (100 IU/ml) for 5 days with or without increasing EPO concentrations or vehicle control. (A) Representative flow cytometric analyses gated on live cells and (B) summarized data quantification of CFSE dilution for six independent experiments using different donors (mean and SEM) and at least 100,000 events per experiment; *P<0.05 versus vehicle at the same dose (two-way ANOVA). (C and D) pAKT and pSTAT5 expression in CD4+ Treg activated with anti–CD3- and anti–CD28-coated beads (25 μl/106 cells) and IL-2 (100 IU/ml) plus EPO (1000 IU/ml) or vehicle control for 5–60 minutes. (C) Representative flow plots at 30 minutes and (D) data quantification show levels of pAKT and pSTAT5 assayed by flow cytometry at times indicated. The results are expressed as percentage of pAKT or pSTAT5 in EPO-treated cells versus IL-2 alone (set at 100%, red dashed line). Data are from five to nine independent experiments with different donors (mean and SEM) with >100,000 analyzed events per experiment. *P<0.05 versus vehicle at the same time point (two-way ANOVA). (E–G) Expression of EPO-R in naïve human CD4+ Tconv and Treg. (E) Immunofluorescence microscopy images of naïve CD4+ T cells and Treg attached to coverslips coated with laminin and poly-D-lysin: (top) bright field, (middle and bottom) stained with AF488-anti–EPO-R antibody or matching isotype (green) together with the Hoechst 33342 nuclear dye (blue). Images are representative of four independent experiments. (F) Representative Imaging Flow single-cell images depicting bright field (column 1), CD4 expression (APC-anti–CD4, column 2), nucleus location (Hoechst 33342, column 3), and EPO-R expression (AF488-anti–EPO-R or matching isotype, column 4) on CD4+ T cells and Treg and (G) quantification of the membrane EPO-R (obtained applying a contour mask derived from the bright field image) and total EPO-R expression for four independent experiments from different donors (mean and SEM). The same number of events (5000–30,000) for CD4+ T cells and Tregs were recorded for each donor. *P<0.05 (paired t test).

