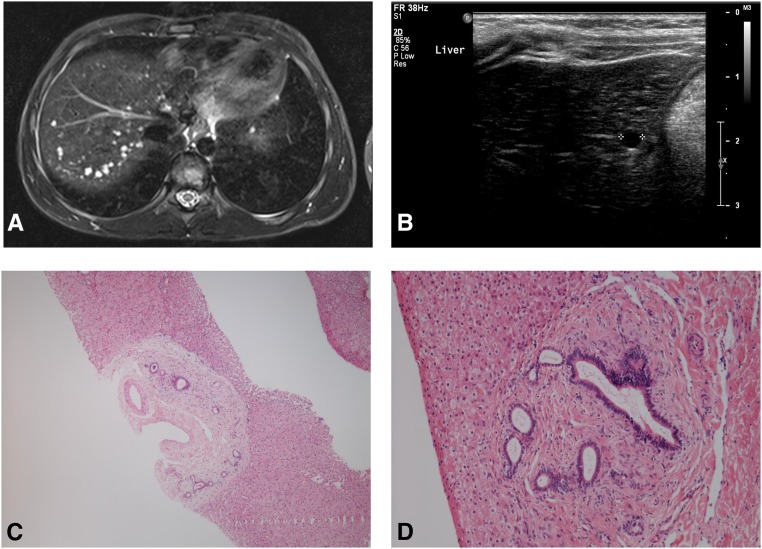
Figure 3.
Liver involvement in HIPKD. (A) Shown is an axial T2-weighted (STIR sequence) MRI image of patient 2.1 showing numerous small liver cysts. (B) Ultrasound image of the liver of patient 2.2 showing a cyst. (C and D) Photomicrographs of the liver biopsy specimen from patient 8.1, demonstrating abnormal and expanded portal tracts consistent with ductal plate malformation (hematoxylin and eosin; original magnifications, ×40 and ×100, respectively).

