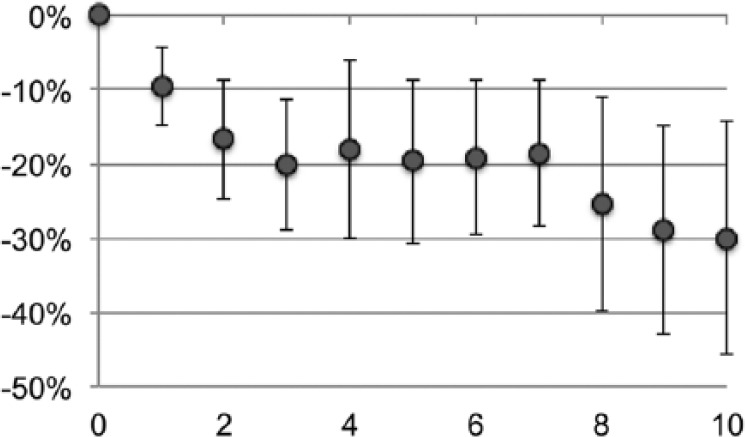
Figure 7.

Cycle-dependent decrease of kidney tissue AF. Variation over time of the kidney tubules AF (em 520 nm), expressed as % channel changes from time 0, over 10 staining and 2ME/SDS stripping cycles. Eleven different areas from three samples have been imaged, and the average intensity change over the starting AF is expressed as % change over 256 channels ± SD. Abbreviations: AF, autofluorescence; 2ME/SDS, beta-mercaptoethanol/sodium dodecyl sulfate; SD, standard deviation.
