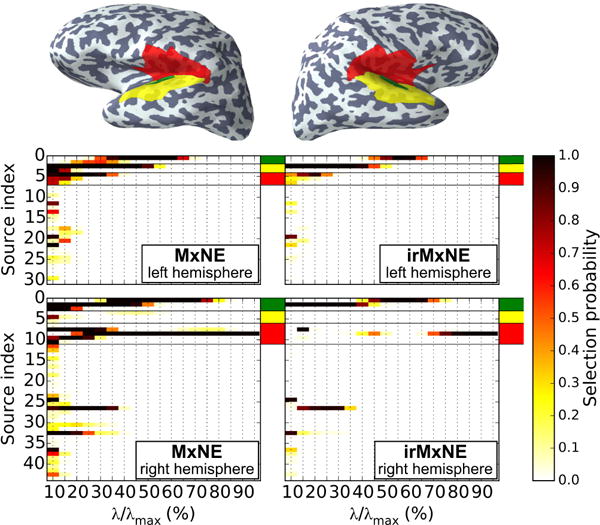
Fig. 4.

Source selection probability for the AEF data set using MxNE (left) and irMxNE (right). The plot is restricted to sources that are active in at least one random subsample. The colored patches on the inflated brain indicate regions of interest based on anatomical labels (green, yellow, red). Source indices, which are in the regions of interest, are highlighted by corresponding color marks. The transversal temporal gyrus is indicated in green.
