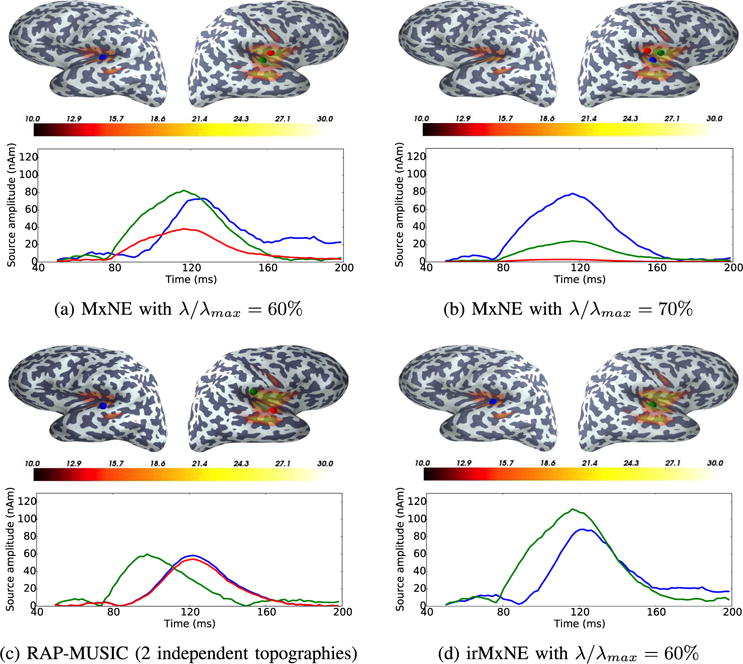
Fig. 5.

Source reconstruction results using AEFs evoked by left auditory stimulation. The estimated source locations for MxNE (a, b), RAP-MUSIC (c) and irMxNE (d), indicated by colored spheres, and the corresponding time courses are color-coded. The maximum of the dSPM estimate per source, which is thresholded for visualization purposes, is shown as an overlay on each cortical surface.
